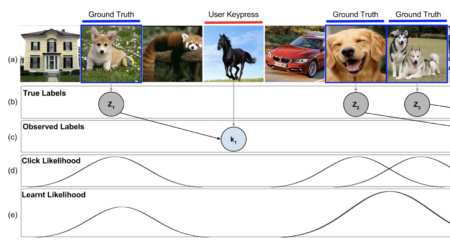
(a) Images are shown to workers at 100ms per image. Workers react whenever they see a dog. (b) The true labels are the ground truth dog images. (c) The workers’
CategoryResearch
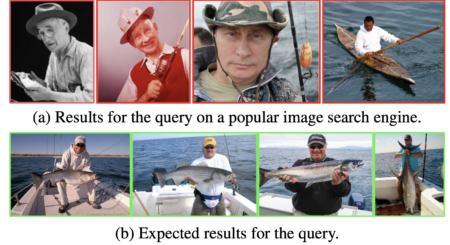
Image Retrieval using Scene Graphs
Image search using a complex query like “man holding fish and wearing hat on white boat” returns unsatisfactory results in (a). Ideal results (b) include correct objects (“man”, “boat”), attributes
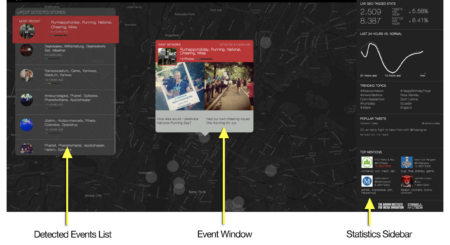
Editorial Algorithms: Using Social Media to Discover and Report Local News
Screenshot of CityBeat interface showing the Detected Events List, Event Window and the Statistics Sidebar Authors Schwartz, R., Naaman M., Teodoro R. Abstract The role of algorithms in the detection, curation
CityBeat: Real-time Social Media Visualization of Hyper-local City Data
Authors Xia C., Schwartz, R., Xie K., Krebs A., Langdon A., Ting J. and Naaman M. Abstract With the increasing volume of location-annotated content from various social media platforms like
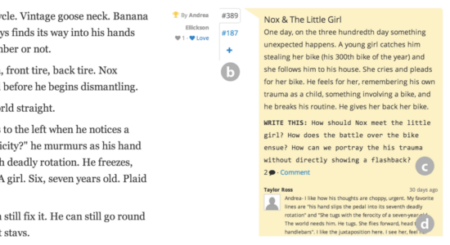
Ensemble: Exploring Complementary Strengths of Leaders and Crowds in Creative Collaboration
A story scene showing (a) the winning draft for a scene. (b) Tabs can be used to switch to different drafts, with the winning draft being shown by default. (c)
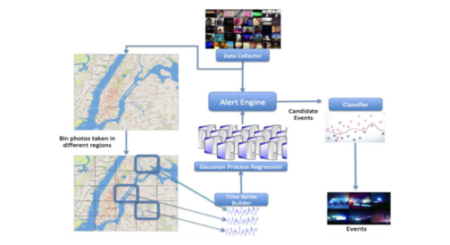
Robust detection of hyper-local events from geotagged social media data
Architecture of our local event detection system. Including data collector, time-series builder, Gaussian Process regression model, alert engine and classifier. Arrows indicate input and output flow of each module. Authors
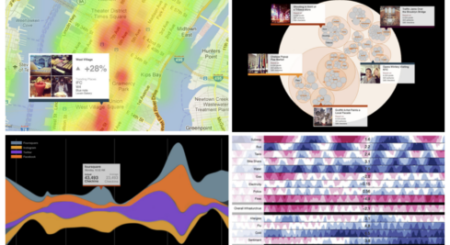
Making Sense of Cities Using Social Media: Requirements for Hyper-Local Data Aggregation Tools
Examples of geo-tagged social media data visualizations mockups. Clockwise: geo-tagged topic groupings, keywords appearance graphs, volume graph and heat map Authors Schwartz, R., Naaman M., Matni, Z. Abstract As more