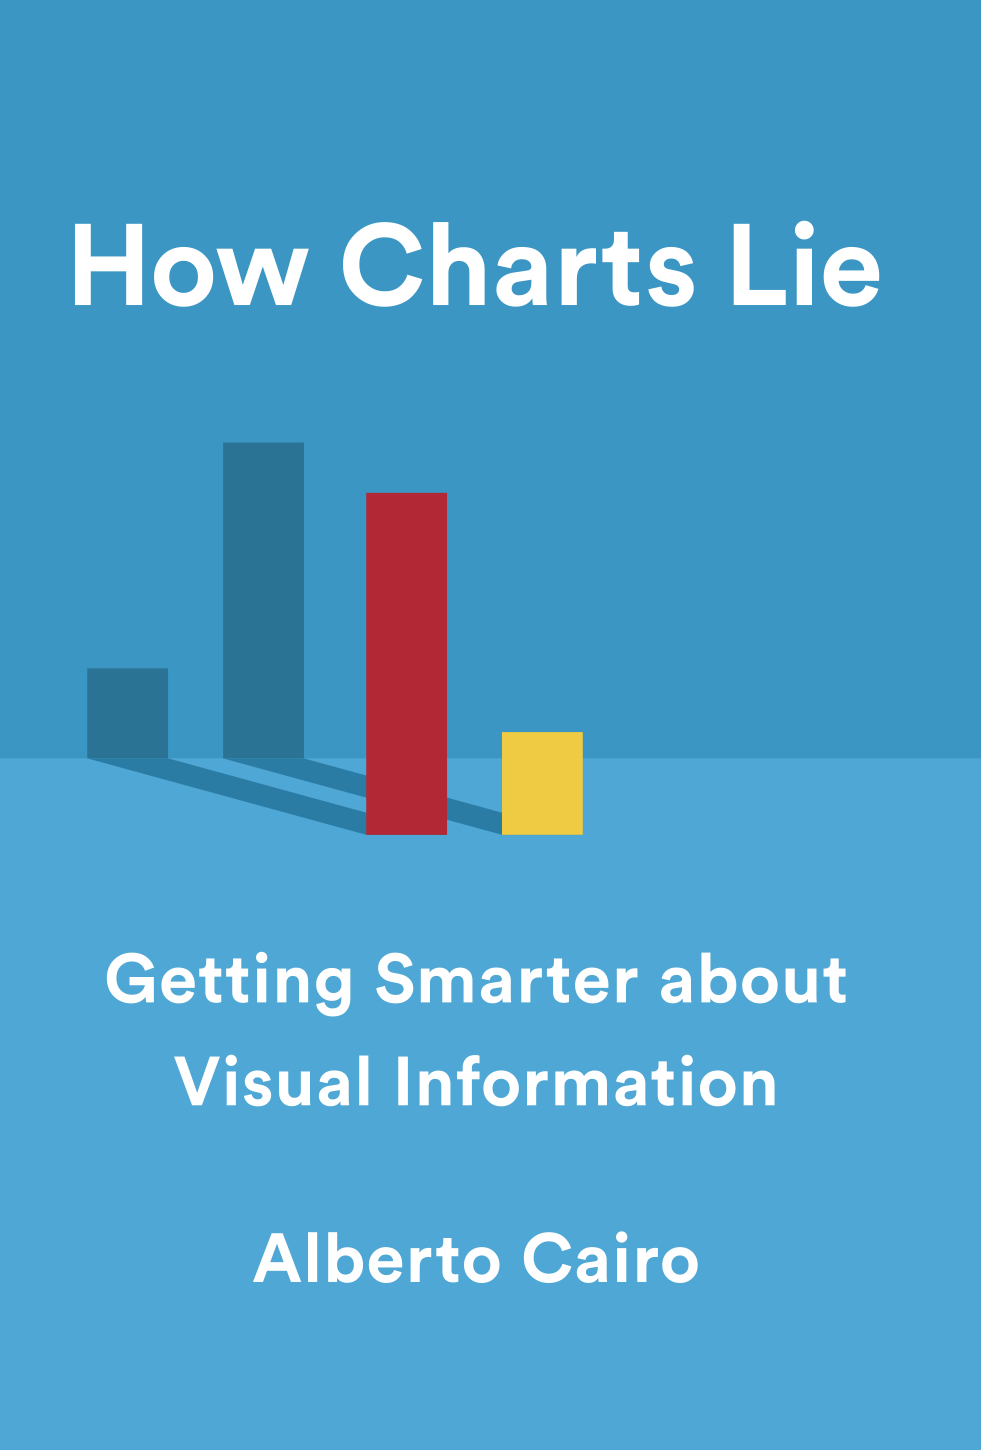
How Charts Lie – A Talk by Alberto Cairo
We’ve all heard that a picture is worth a thousand words, but what if we don’t understand what we’re looking at? Charts, infographics, and diagrams are ubiquitous. They are useful
Presenter Allison Parrish, NYU Workshop Description Much like other forms of data, documents and text provide enormous potential as a form of data to be analyzed and visualized. This workshop
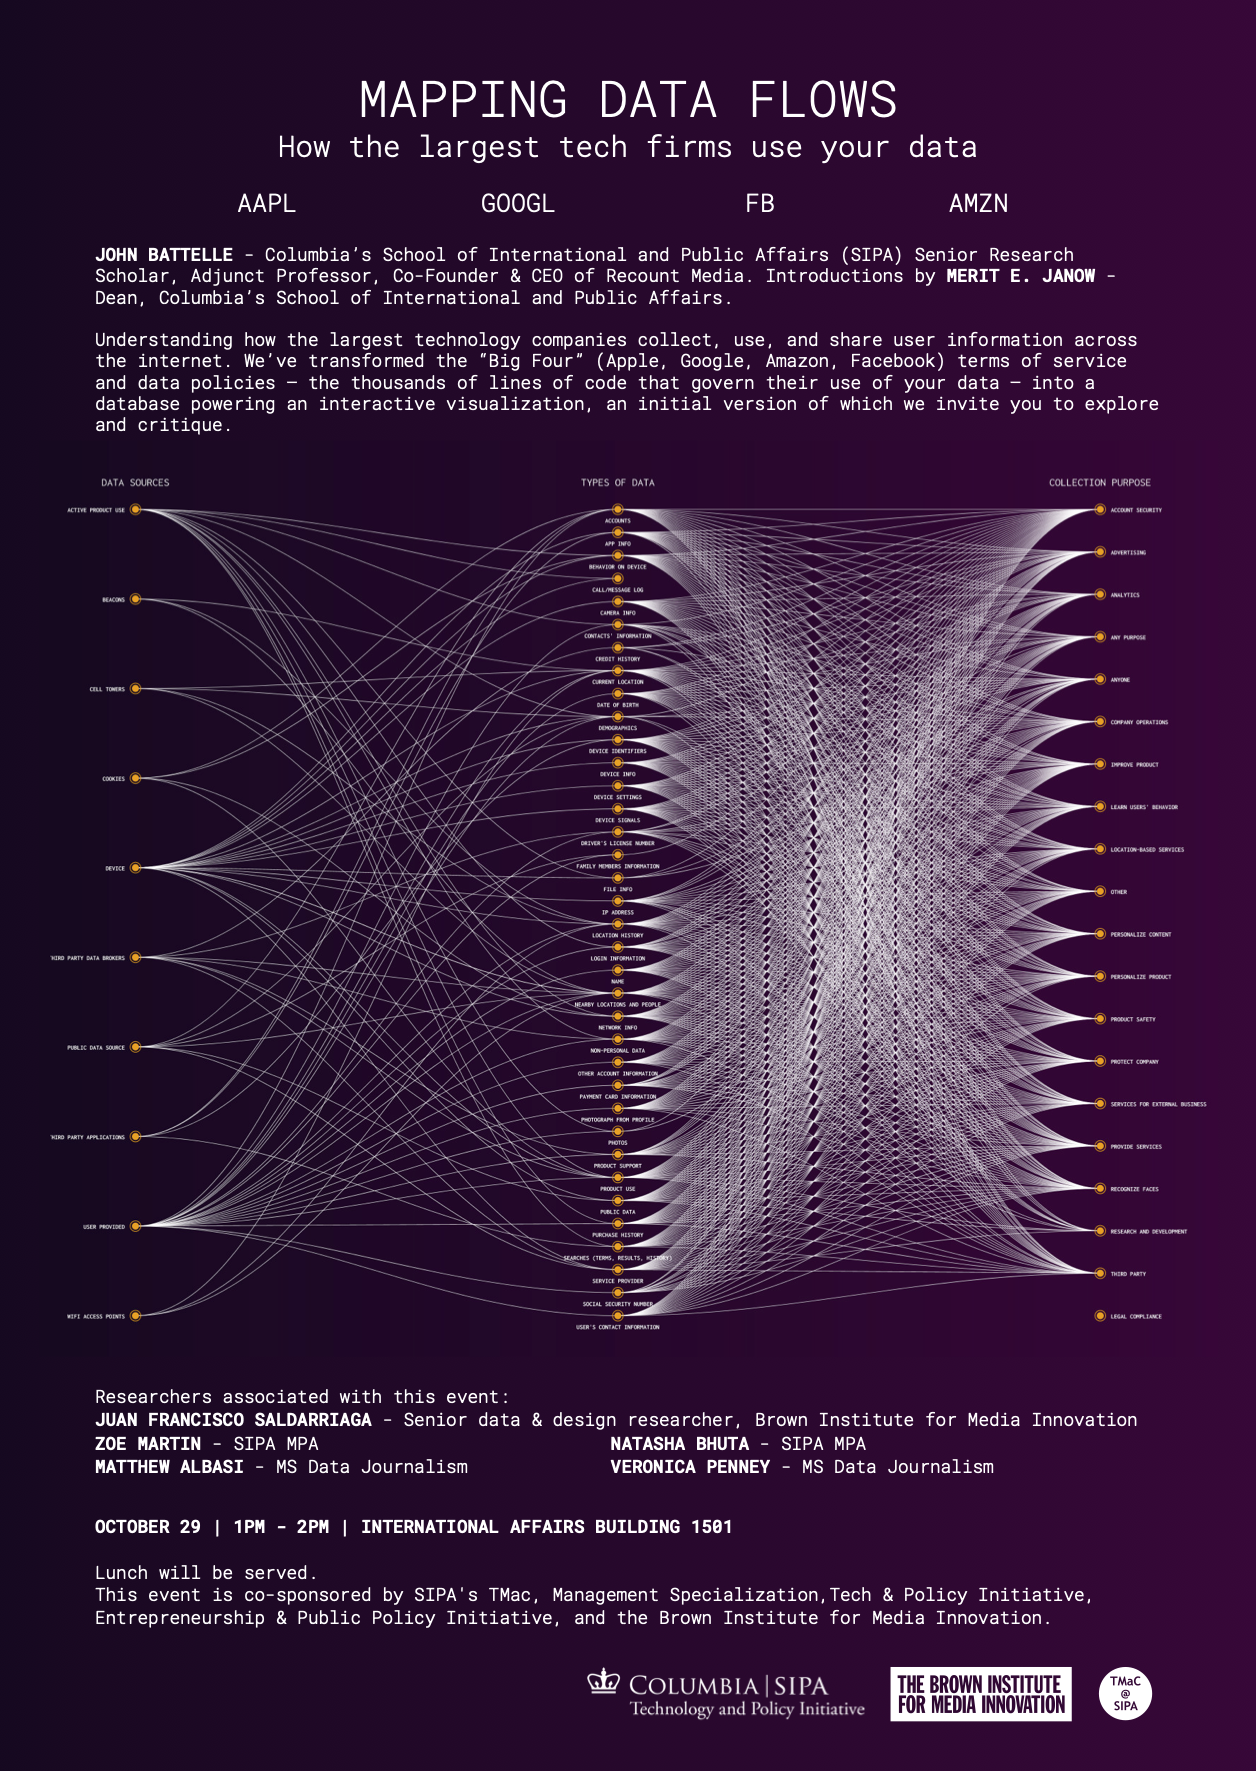
Join John Battelle — Senior Research Scholar and Adjunct Professor at SIPA, and Co-Founder & CEO of Recount Media — and a team of researchers from the Brown Institute for
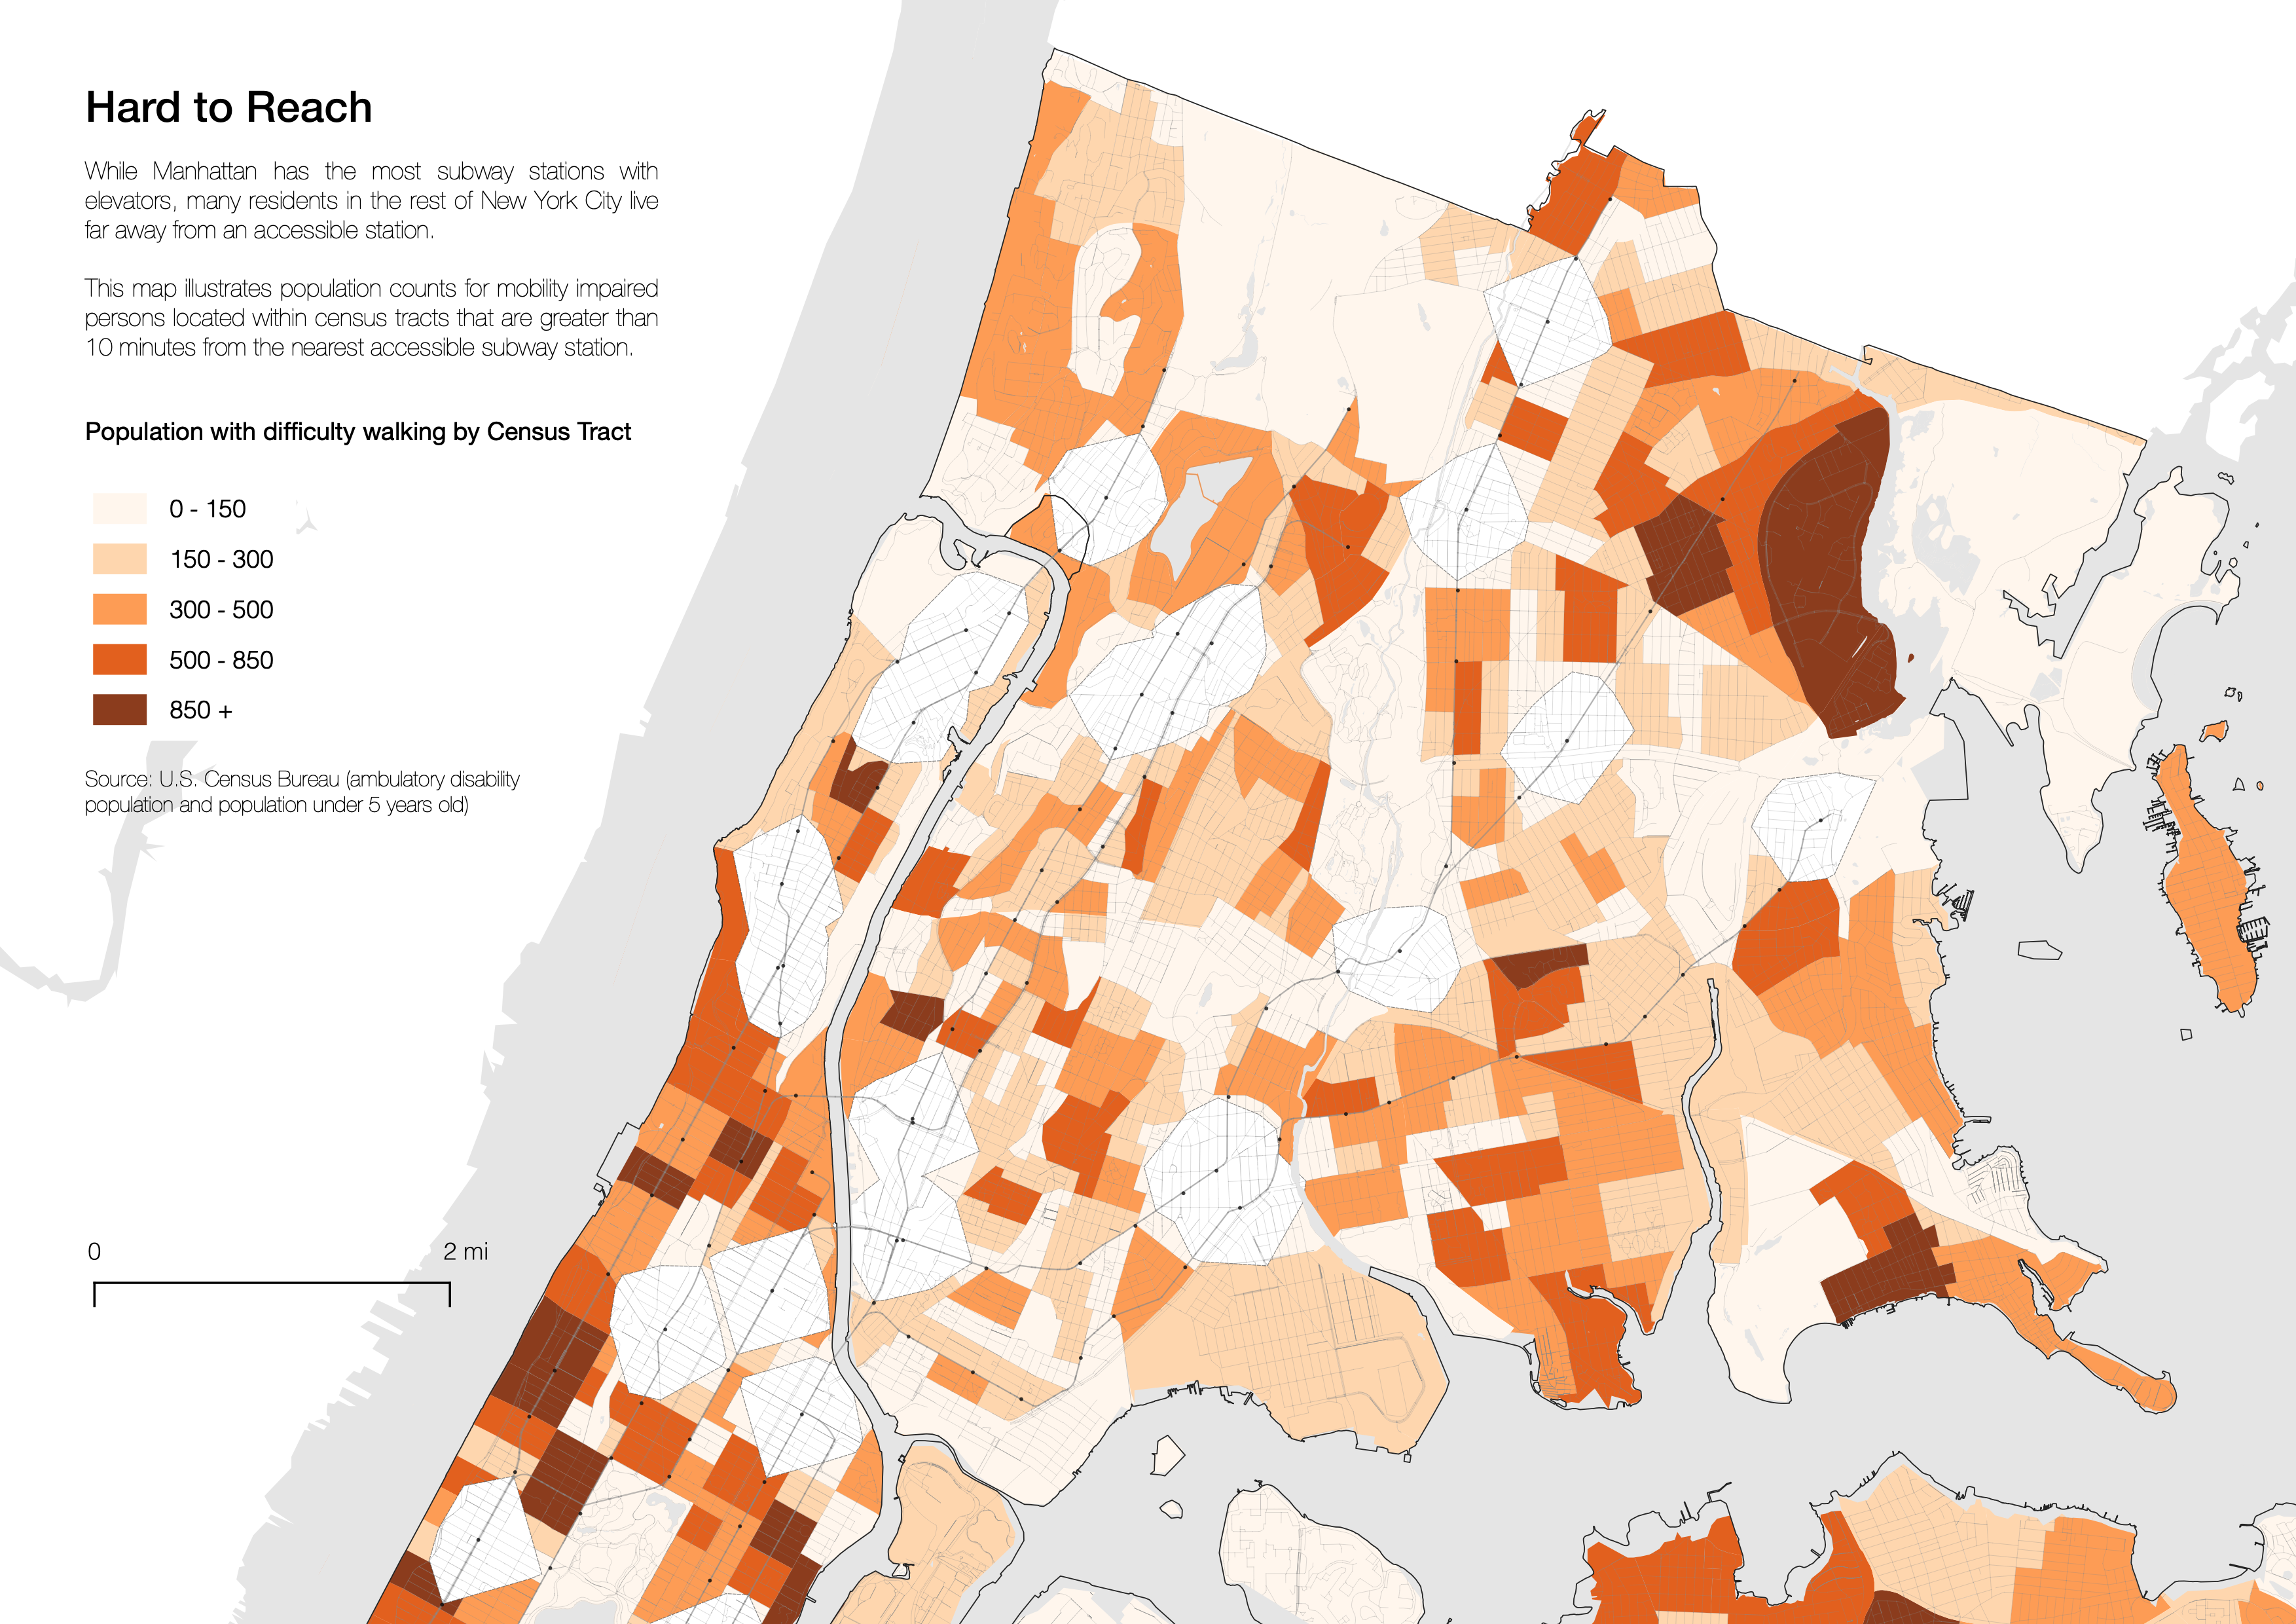
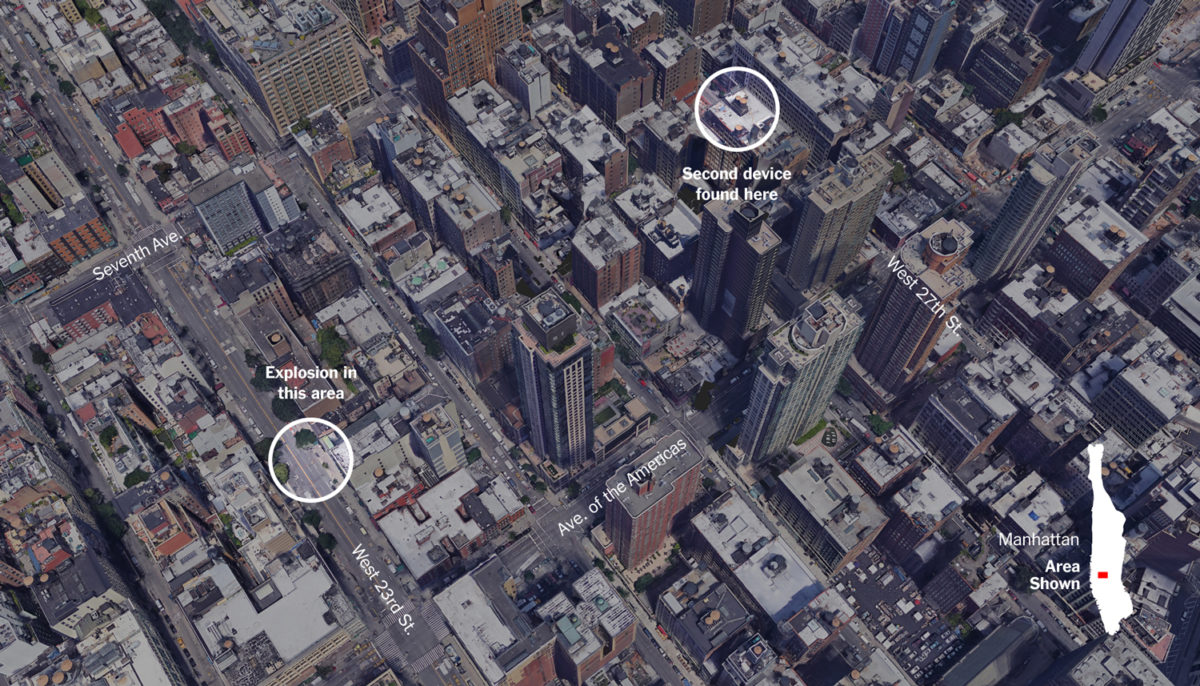
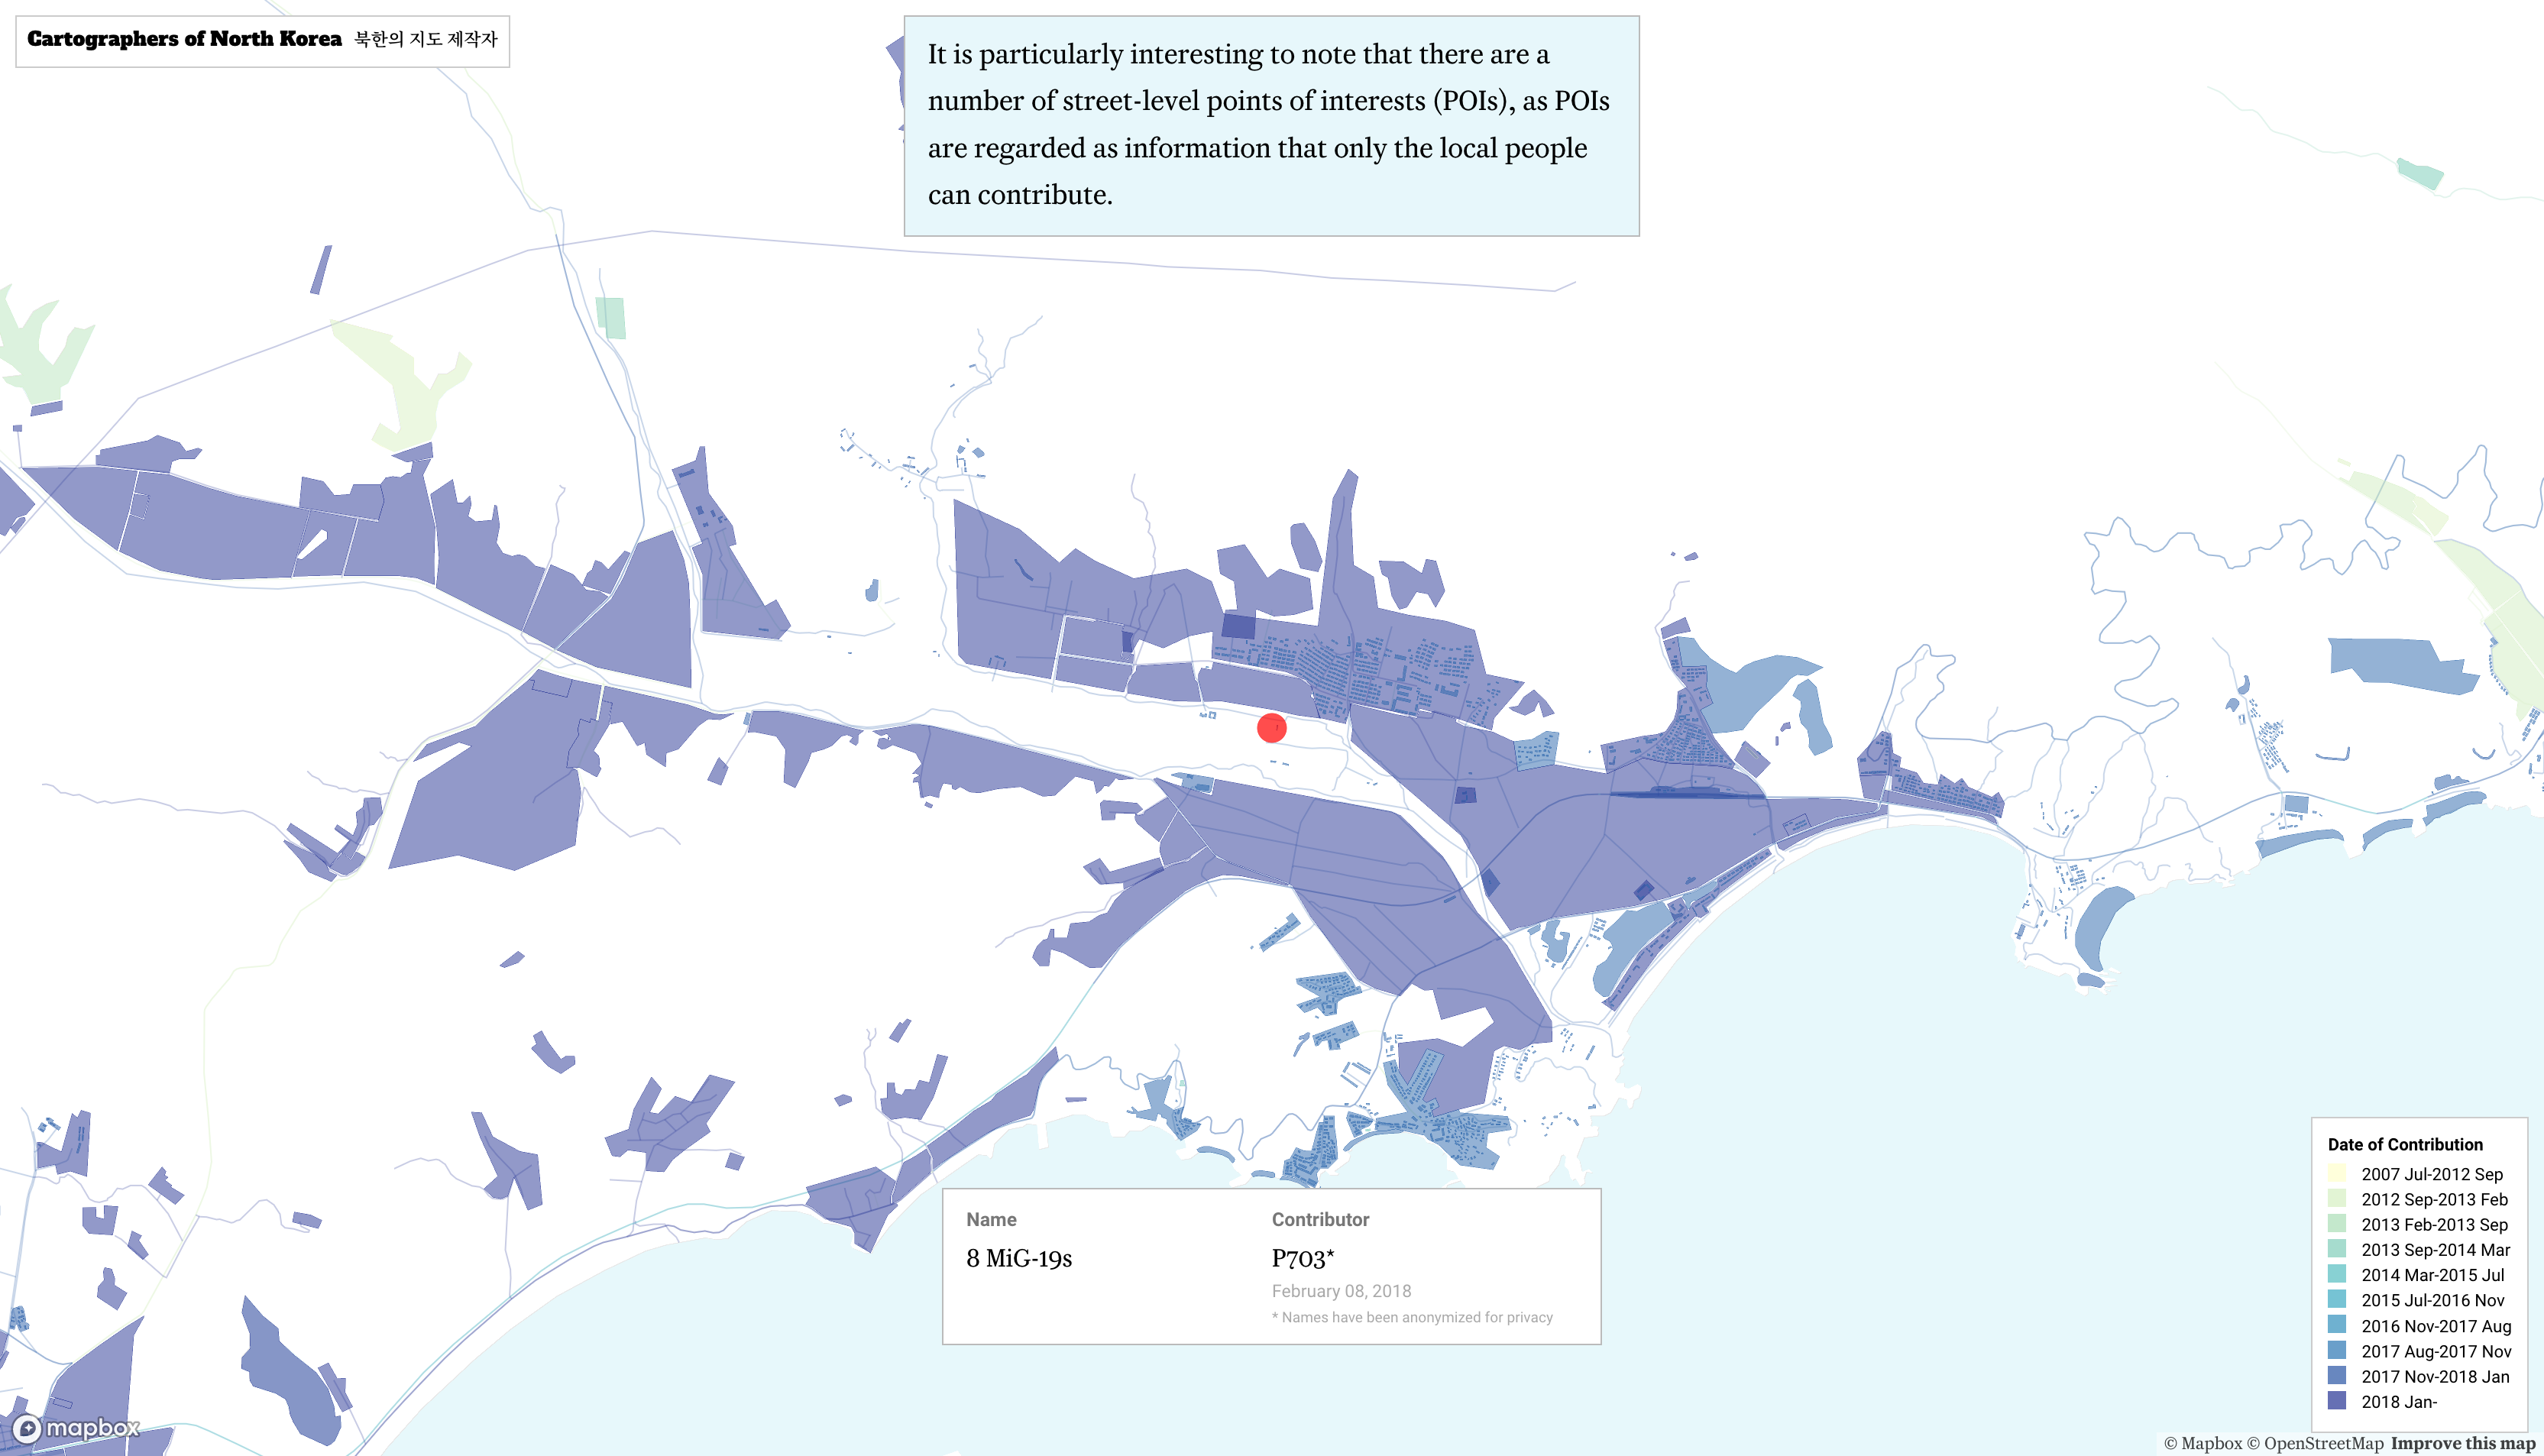
News unfolds in places and every newsworthy event is shaped by the details of location. Those details might include the specifics of a neighborhood as it is today or of
Presenter Craig Silverman, BuzzFeed Workshop Description Twitter is not just a source of updates from friends and happenings in the local community. Instead, it is a dense network embedded with
Presenter John Keefe, Quartz Workshop Description Data, code and algorithms are changing systems of power in our world, often without sufficient critical assessment or accountability. Today’s journalists need to understand
The Brown Institute and the Foundations for Research Computing program welcomes Travis Oliphant, CEO at OpenTeams and Quansight, founder of Anaconda, and creator of NumPy, to deliver a Distinguished Lecture
From augmented, mixed and virtual reality, to 3D storytelling, immersive technologies provide new opportunities for journalists to broaden their stories and engage readers. While these technologies have been deployed in
The Brown Institute is excited to welcome Sean Rameswaram, host of Today, Explained, Vox’s daily explainer podcast. As advertised by Vox, Today, Explained is your all killer, no filler, Monday
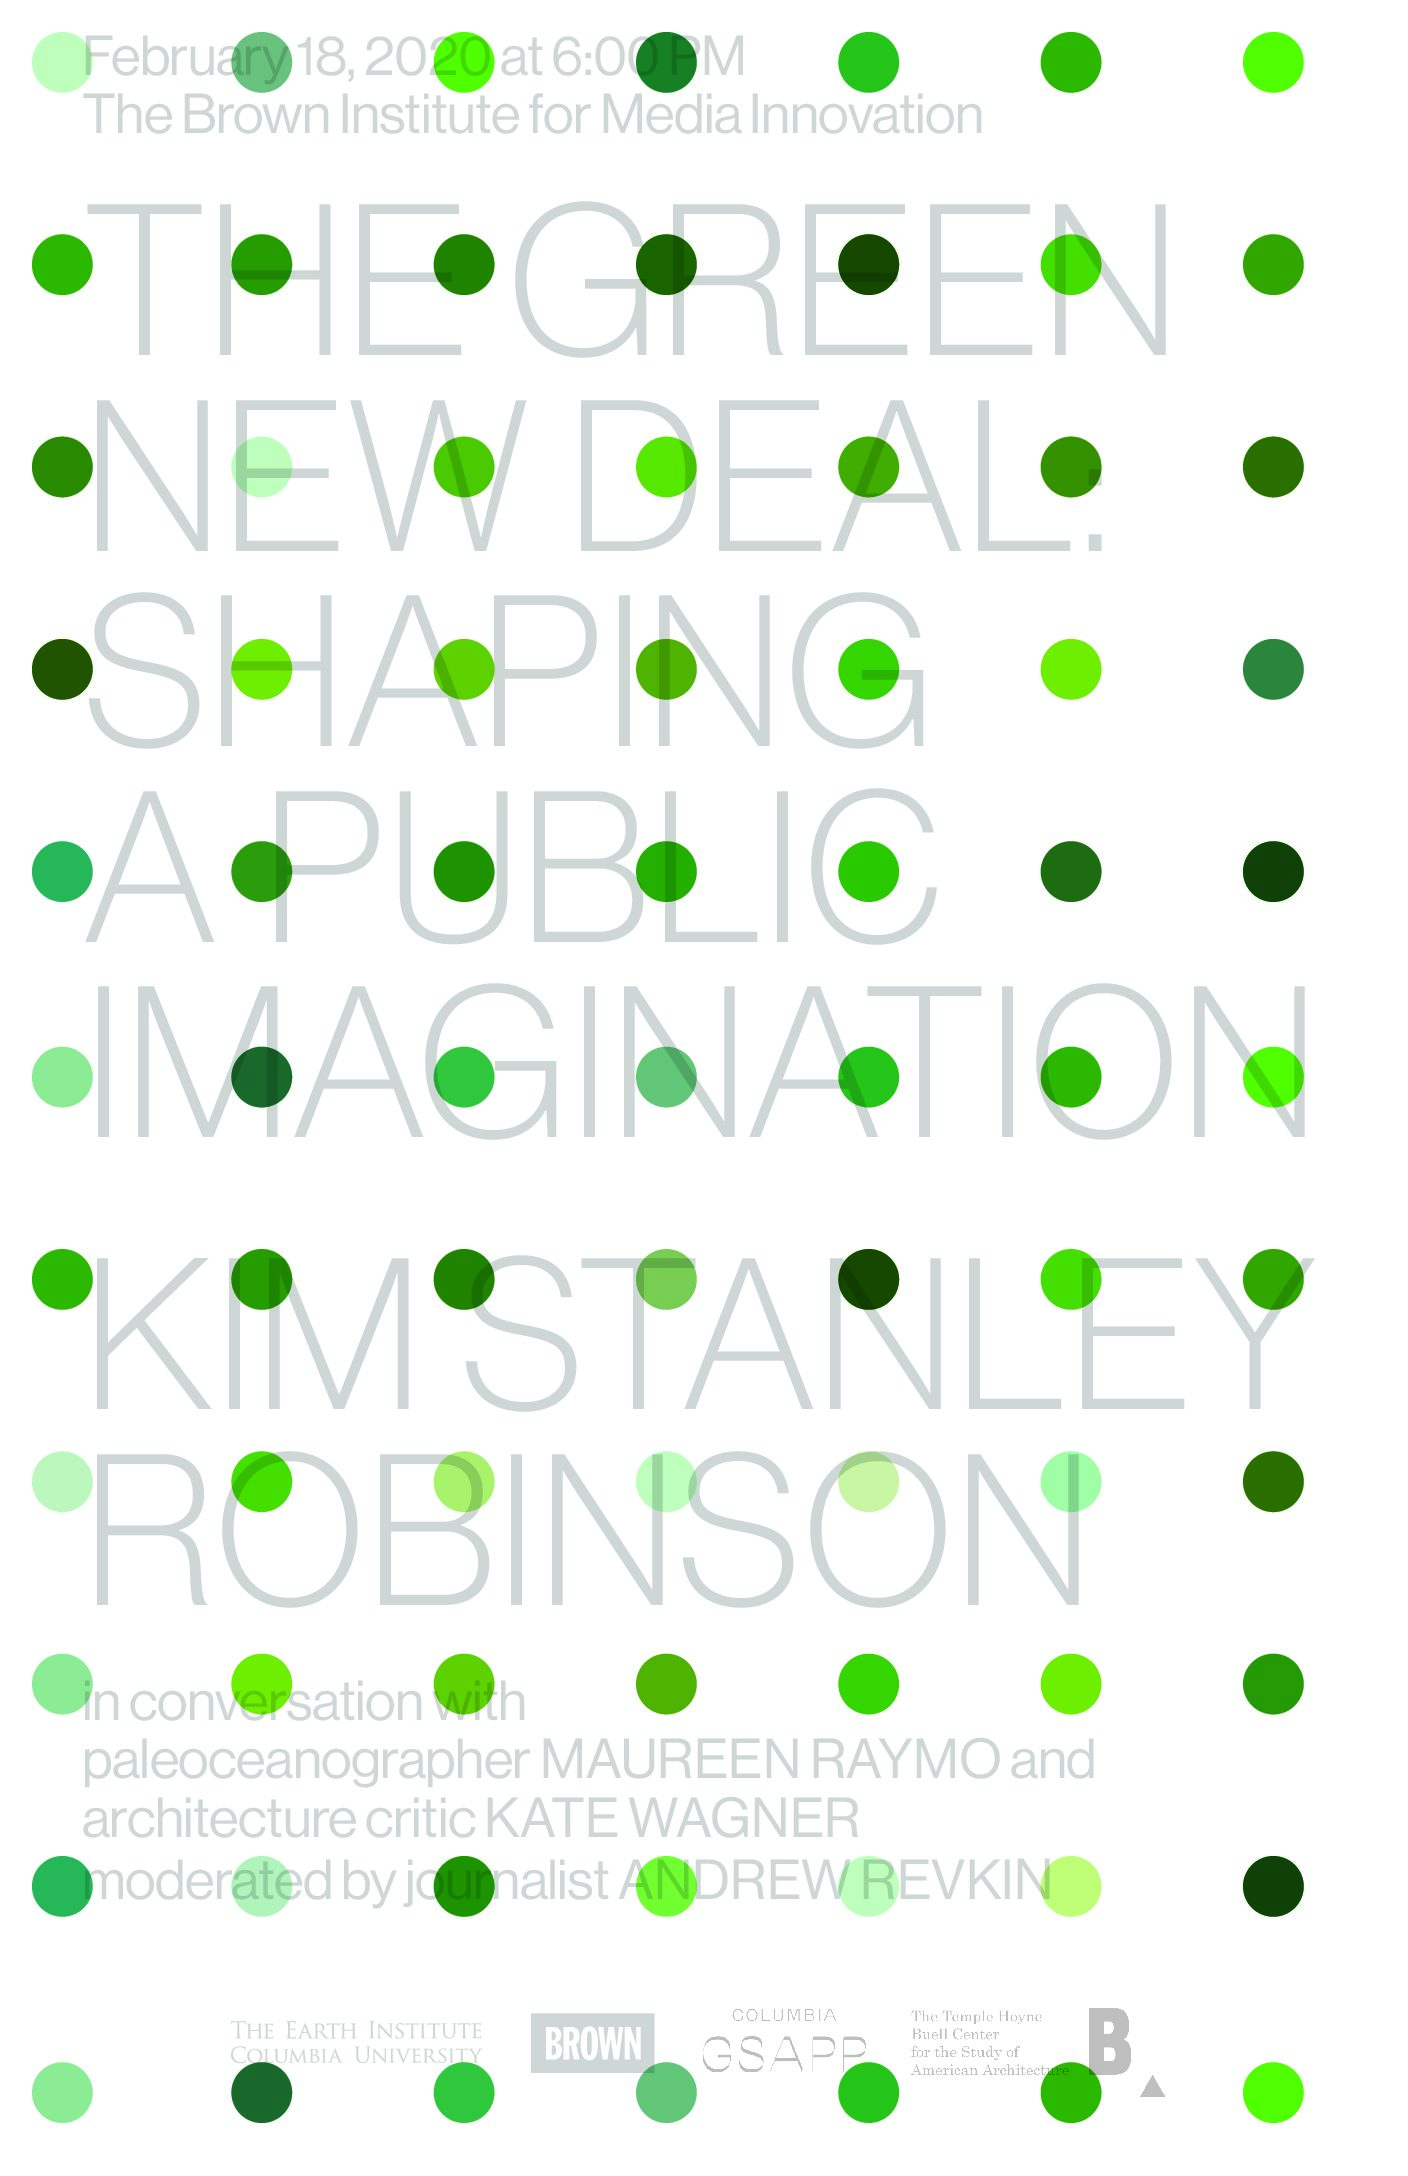
Can climate fiction help overcome political friction? When climate change is the focus of both fiction and nonfiction, dystopia tends to rule. It’s not hard to see why, given that
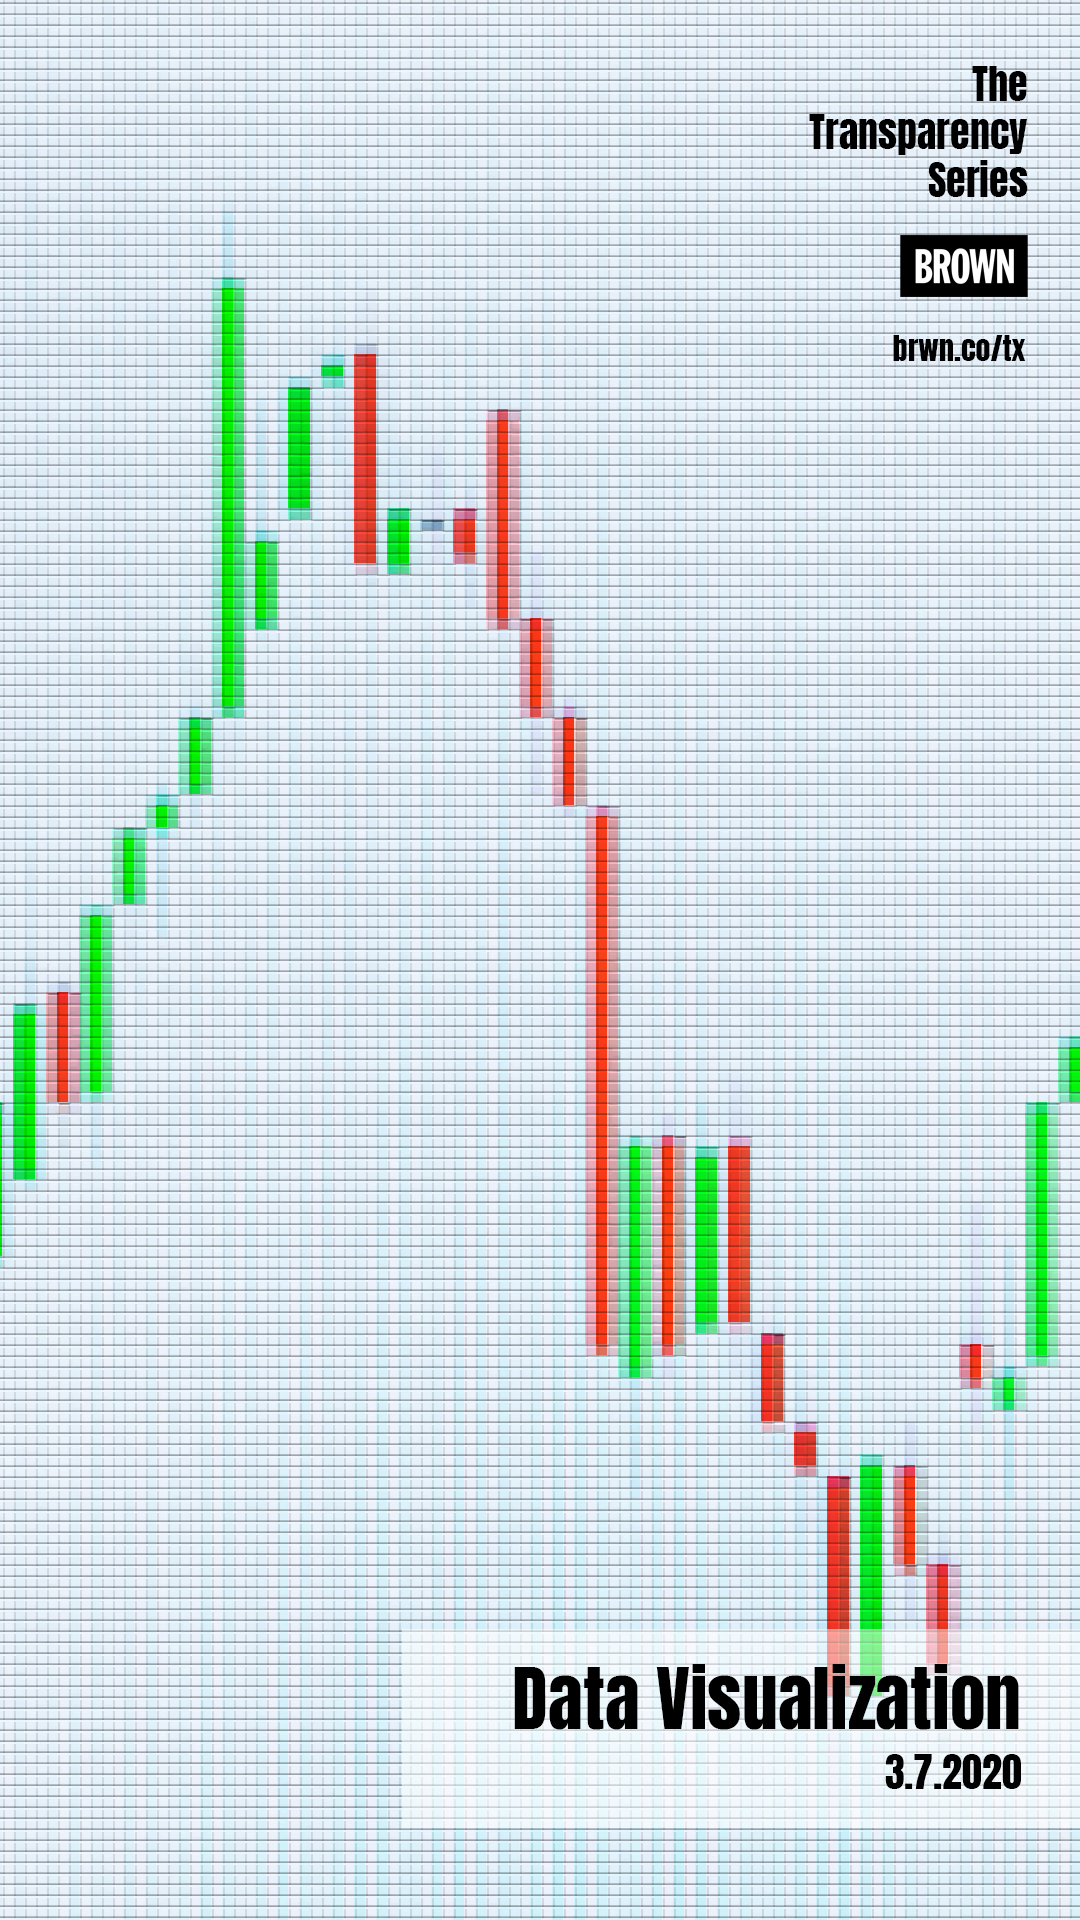
Presenter The Pudding Workshop Description Graphical (or pictorial) presentations of data have become an almost essential part of journalistic practice. Data visualization helps us see patterns in data, and is
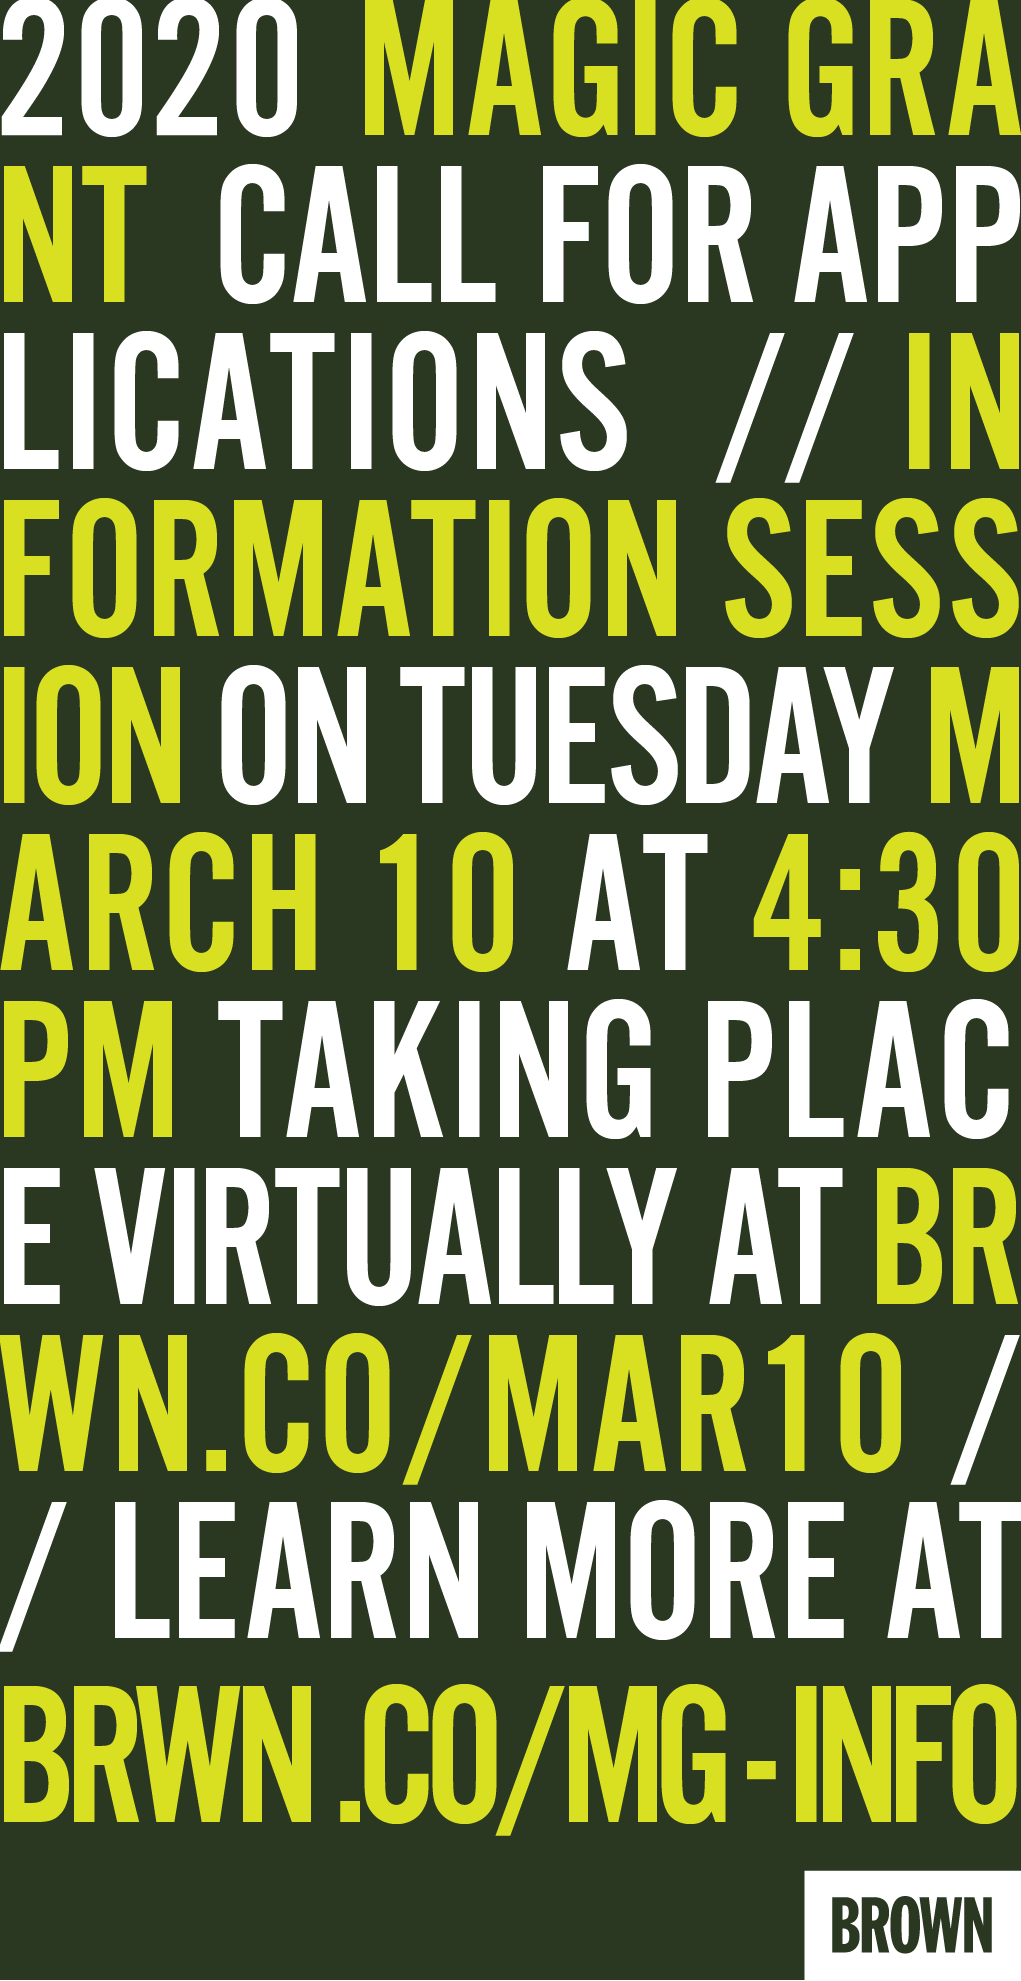
The Brown Institute is pleased to announce our first Magic Grant Information Session taking place virtually for the Columbia side of the Brown Institute on March 10, 2020 at 4:30PM.
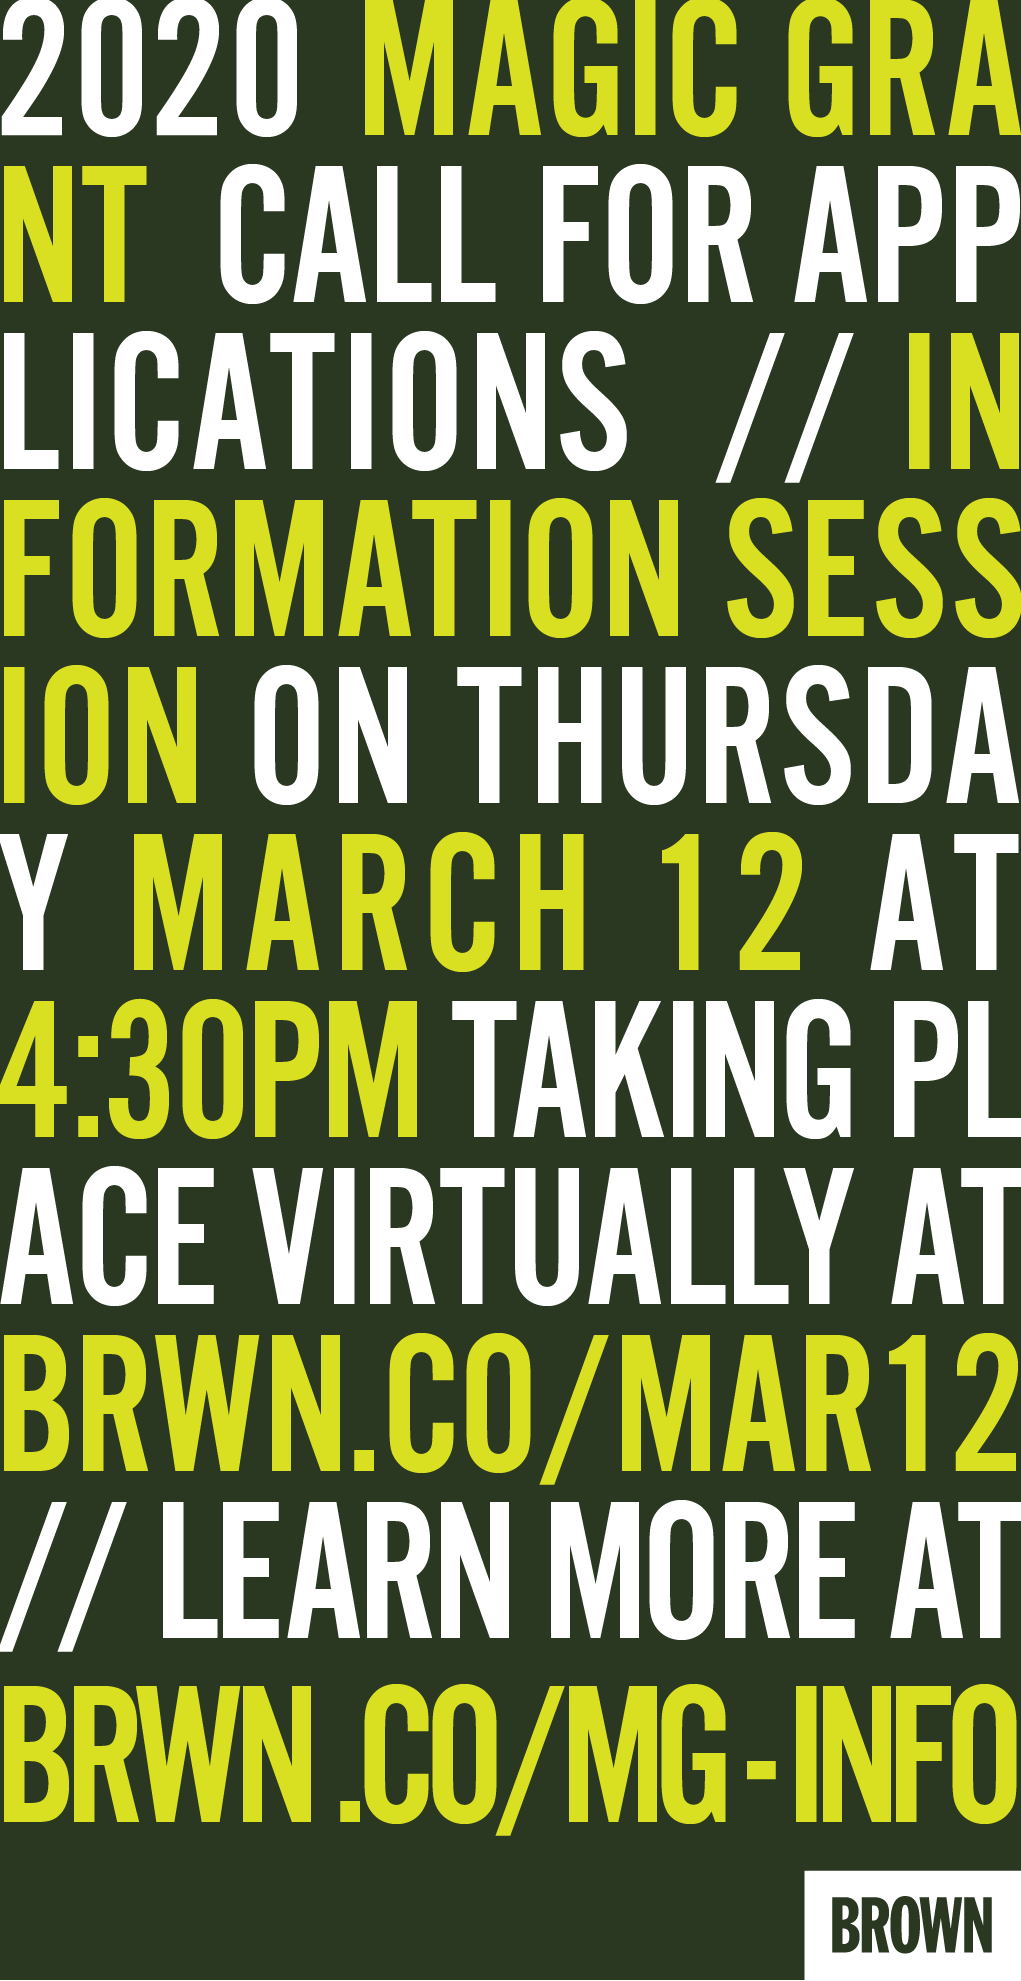
The Brown Institute is pleased to announce our first Magic Grant Information Session taking place at Stanford Engineering via a virtual webinar on March 12, 2020 at 4:30PM. To join
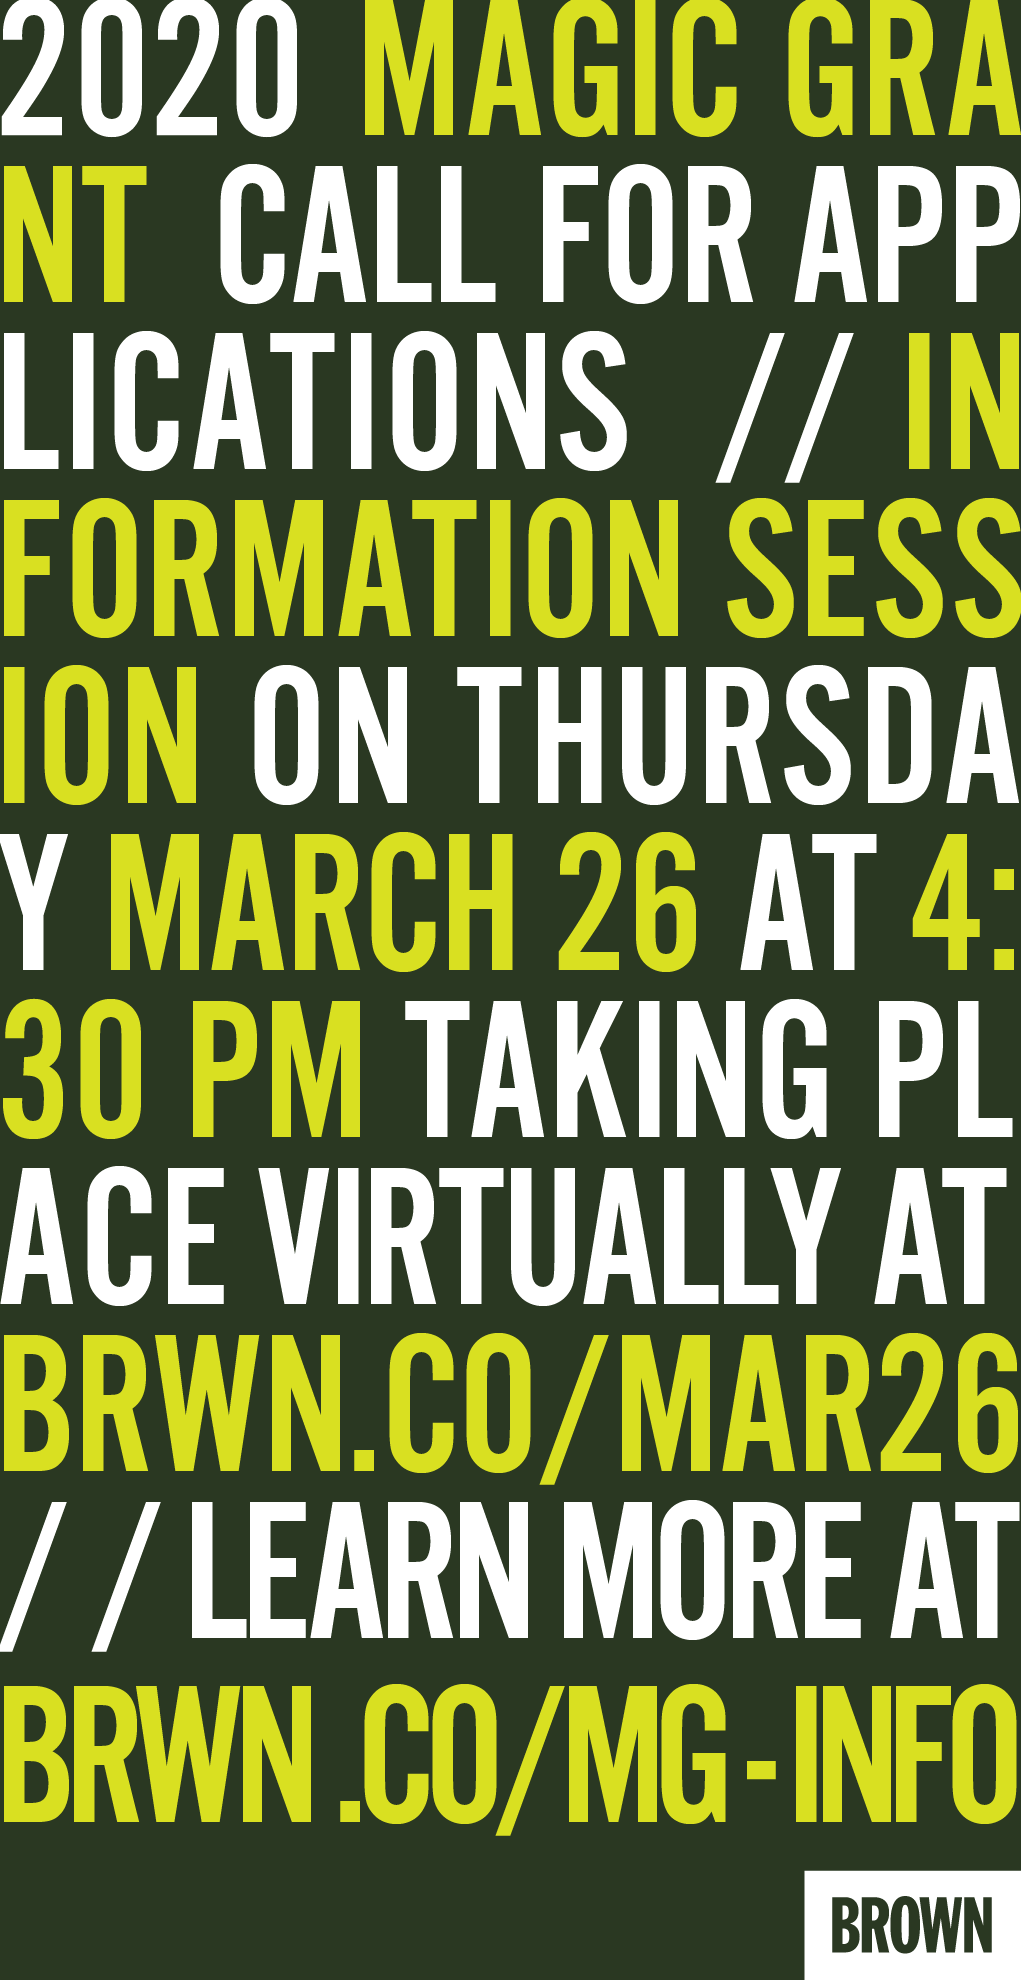
The Brown Institute is pleased to announce our second Magic Grant Information Session taking place virtually for the Columbia side of the Brown Institute on March 26, 2020 at 4:30PM.
The Brown Institute is hosting virtual Magic Grant Information Sessions taking place each Thursday on Zoom at 4:30PM EST. To join, please use the link below: https://zoom.us/j/911667097 Password: 751054 If
The Brown Institute is hosting virtual Magic Grant Information Sessions taking place each Thursday on Zoom at 4:30PM EST. To join, please use the link below: https://zoom.us/j/911667097 Password: 751054 If you’re interested in learning more about our Magic Grant offerings, come to our upcoming information session where you can find out: The types of projects
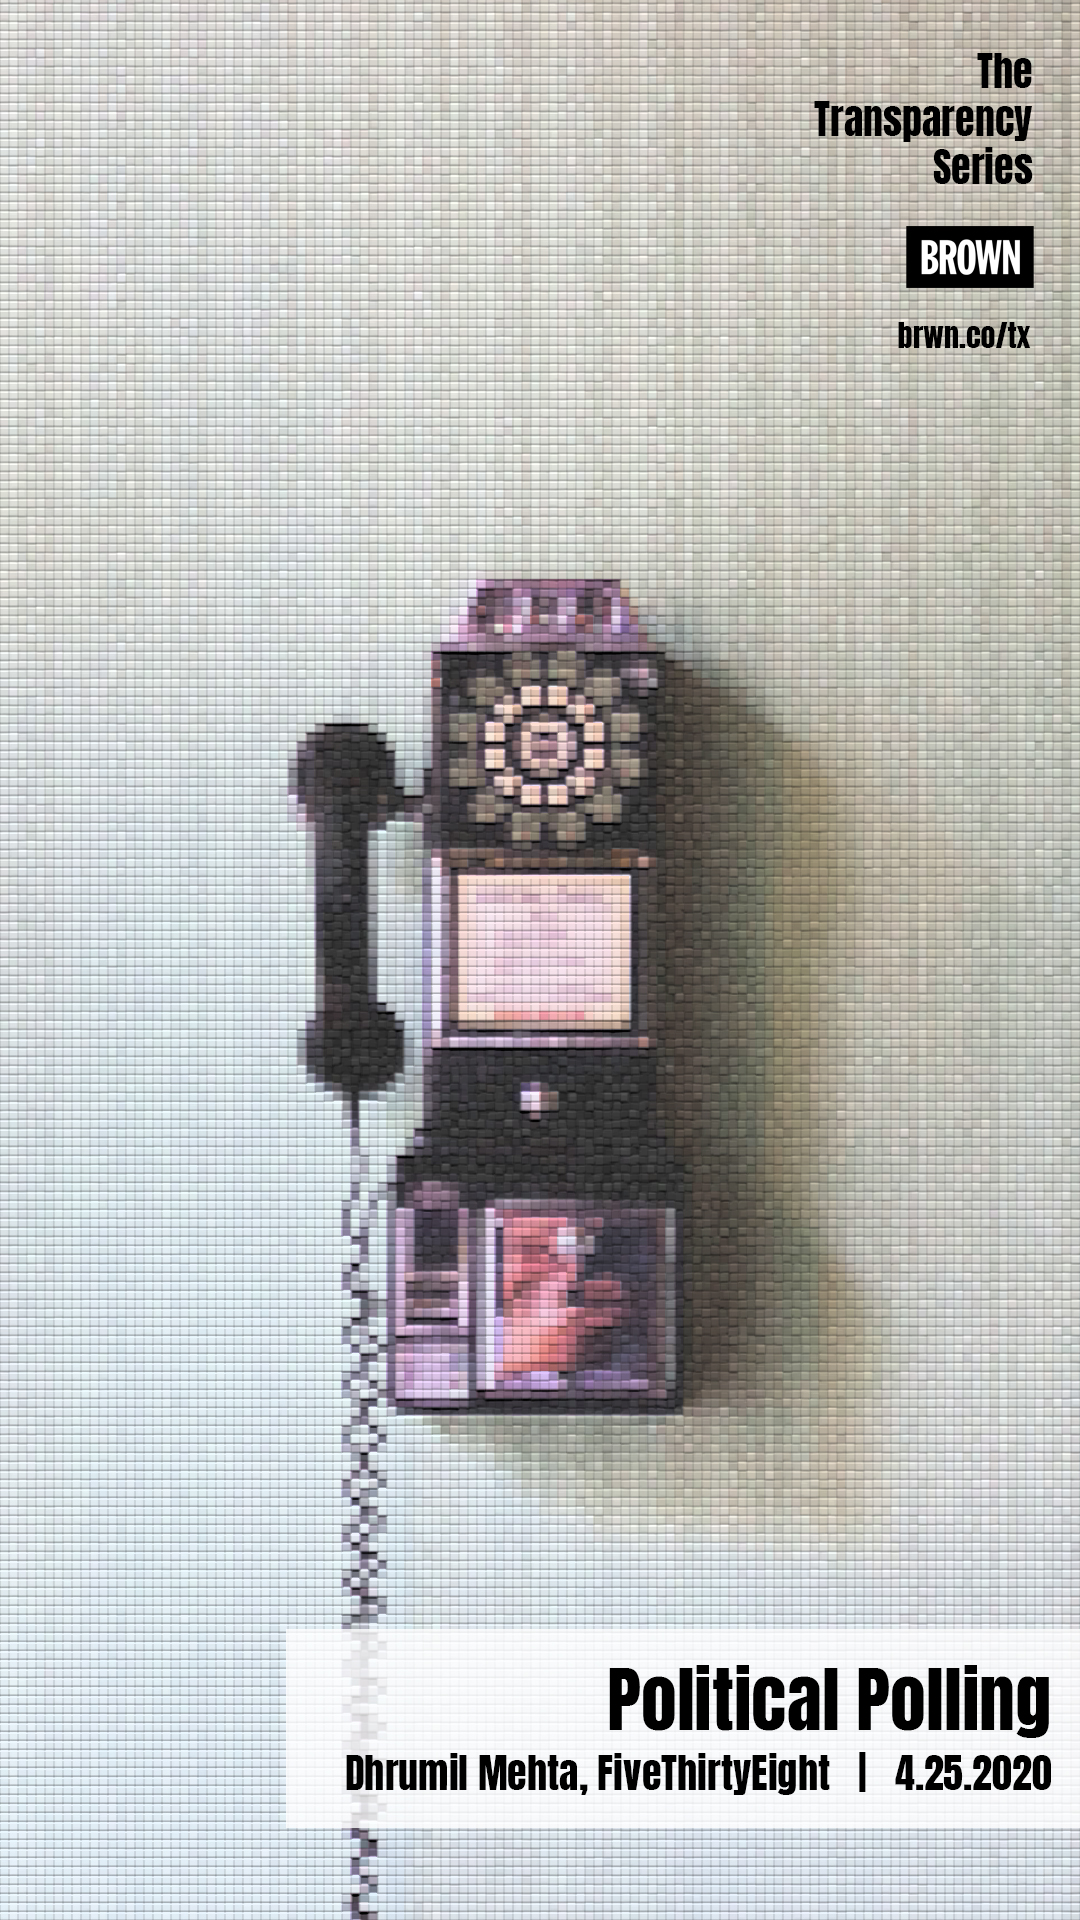
Presenter Dhrumil Mehta, FiveThirtyEight Workshop Description The last workshop in the Transparency Series takes you through techniques for looking at one or more polls over time. Join Dhrumil Mehta who leads Pollapalooza at FiveThirtyEight to get exposed to sources, tools, and strategies for working with polls — starting at the very beginning with simple random