Major advances in computation have made mapping local news easier. What can we learn from analyzing where stories fall on a map?
Last fall, the Brown Institute and The Lenfest Institute for Journalism’s Lenfest Local Lab came together to try to answer some shared questions about the relationship between geography, quality and experience in local news. The combination of our resources takes advantage of both organizations’ strengths in data, media, and innovation. The Brown Institute often focuses on databases and predictions, including projects aimed at telling stories through the large sets of public and/or private data (canners, democracy fighters) to computational tools that synthesize information from large corpuses of documents (declassification engine, datashare). Meanwhile the Lenfest Lab, an innovation program of the Lenfest Institute, launched a series of experimental products with The Philadelphia Inquirer last year that explore the possibilities of putting a readers’ location at the center of their local news experience. Lab projects included an app that displays local restaurant reviews based on proximity to the reader and an architecture news app that alerts users to stories written about places they walk by.
We conducted an initial review of research in the area of mapping and local news, and we agreed that developing an automated approach to identifying and mapping locations found in news article text would be a valuable exercise for our ongoing research and product development experimentation. For the Lenfest Lab, a tool like this could help the team identify opportunities for experiments beyond single-topic products for audiences within a small geographic area. For the Brown Institute, a mapping tool builds on the expertise of research staff at the institute and furthers efforts currently underway to develop open-source products for local news.
The project’s inspiration: A study of Toronto Star coverage
In 2009, April Lindgren of Ryerson University published a paper in the Canadian Journal of Urban Research titled ‘News, Geography and Disadvantage: Mapping Newspaper Coverage of High-needs Neighbourhoods in Toronto, Canada’. The purpose of the research was to examine Toronto Star news coverage, measuring the quantity and subject matter of coverage by geography. Specifically, the study sought to compare reporting across geographies — looking at the various ways in which the Toronto Star reported on areas that the Strong Neighbourhoods Task Force, a government-run coalition, defined as “troubled areas” or defined pockets of social need and poverty.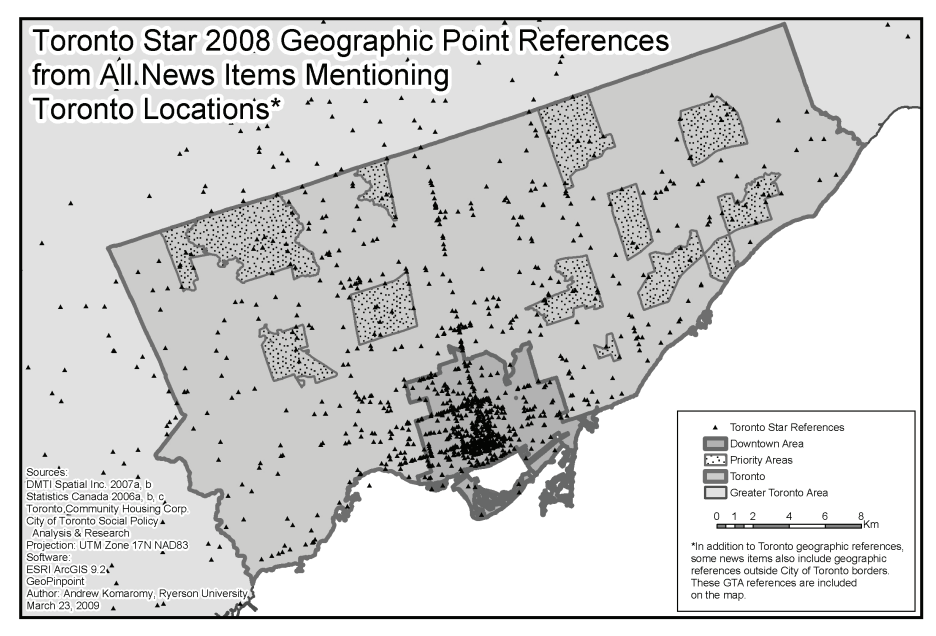
The study was conducted by a team of researchers who scanned 28 print editions of the Toronto Star from an eight-month period in 2008, highlighting the locations found in each article. The locations were then placed on a map and analyzed. In total, 2,731 stories were analyzed amounting to 5,697 locations. In the research paper, the authors drew conclusions that hint at the significant impact a tool of this nature could have if it could scale and be implemented by newsrooms small and large, agnostic of location. One such conclusion revealed that a disproportionately high percentage of the reporting by the Toronto Star about the “troubled areas” was crime-related. This statistic points to great opportunities to analyze and understand how news coverage shapes public opinion and represents communities. The simple act of placing news on a map allows for new types of questions to be asked and for new business opportunities to be explored.
Due to the manual nature of the study, both in the location extraction and the location mapping, the conclusions were limited, narrow, and static. Since the release of the study major advances in computation, specifically in the areas of natural language processing, machine learning, and GIShave taken place. These advances make much of this work automatable and scalable and provide new opportunities for products and research in the computational journalism ecosystem.
An overview of our project
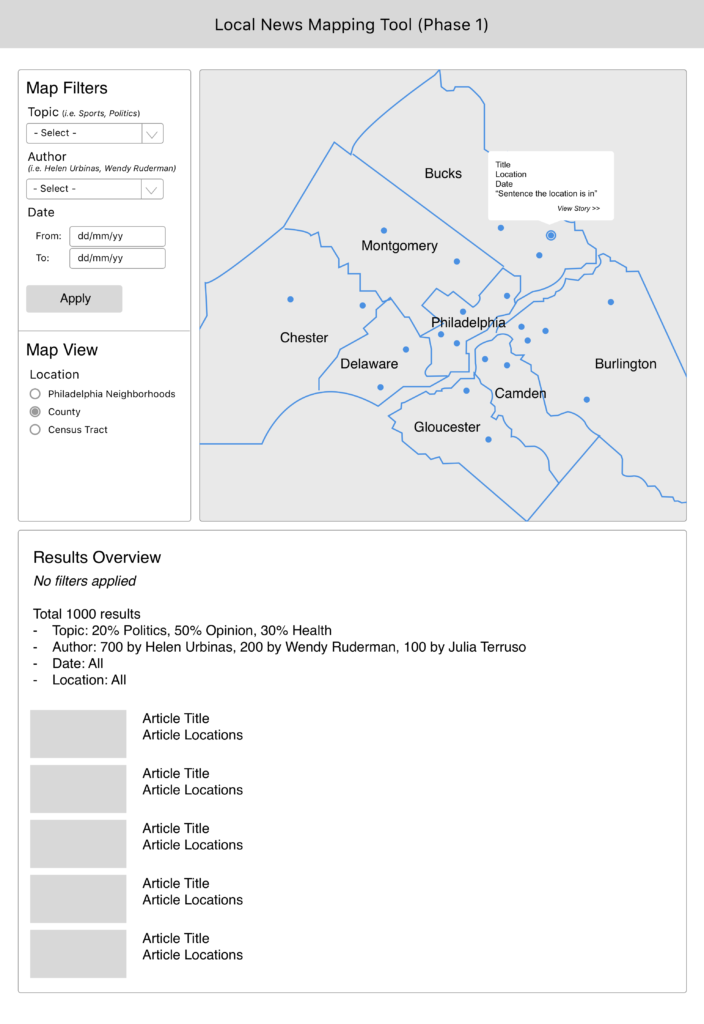
The tool
The tool is currently under active development and employs a mix of natural language processing, deep learning, and geolocation techniques with an aim of automatically mapping locations found in local news text.
The goal
The goal of our project is to build an open-source tool that allows any newsroom to deploy the system on a complete and growing corpus of articles. From location identification to geolocation and disambiguation, the act of identifying a place from a set of places sharing a common name, there are interesting challenges to confront, starting with the simple question of what constitutes a “location” in a news story? Is it simply where something transpired, or is it all mentions of geography? And what do you make of ambiguous references (i.e., “two blocks north of City Hall”), which are easy for a reader with sufficient context to understand, but mystifying to a machine?
The questions our project seeks to answer
In its most rudimentary form, our guiding question is simple: what can be learned from seeing a set of article locations on a map? But this simple question led us to many others:
- How does local news coverage lay out across a region? If there are gaps, how can they be filled? Should they be?
- Does the sentiment, length, or frequency of local news coverage vary by geography? If so, what might the underlying reasons be?
- Are there tools that can be built to solve any issues that the map may uncover?
- Are there ways to provide automatic local angles to national stories?
- What types of geography exist in news? Points, lines, polygons? How are stories with various locations evaluated and presented on the map?
- Can we predict where news is happening but it isn’t getting covered?
- Does the quantity of local news reporting scale in proportion to the population of an area? If not, why?
- What trends within news coverage can only be explained by pairing time and geography?
Where are we now?
The open questions and potential risks
While we are excited and optimistic about the potential of this local news mapping tool, part of our work has been to discuss openly any major challenges we may encounter with the completeness or accuracy of the data as well as any risks associated with displaying this data on a map to make decisions about local news coverage. For example:
- Are the majority of local news stories even map-able? If not, does that limit the potential of the tool?
- Should we map the location/s where the story took place or all mentions of locations within a story? How does that impact the value of the tool?
- If multiple locations exist within a story, how might we prioritize or rank them on a map? How do we address duplicate mentions of a location in a story?
- Is it possible to map the radius of where people live who are affected by what’s happened in the story? If so, how would that data be used?
- Could we take the tool a step further, and map the location/s of the sources quoted in each story? What would that tell us?
- Can other geographical datasets (i.e. population, maps of subscribers, maps of population organized by demographics) augment our news layer map and serve as a benchmark/index?
- Do some locations lend themselves to specific beats? Does this vary by local news organization?
- What are the accuracy standards by which the tool can be deemed usable?
The implementation process for the prototype
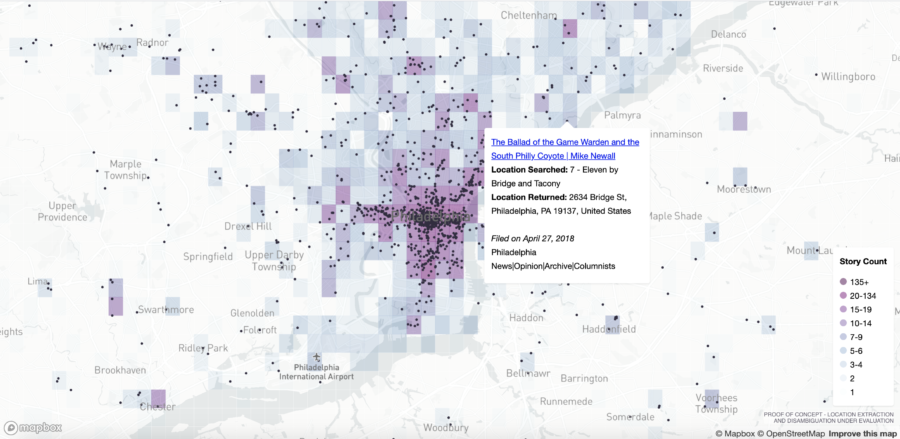
For the initial prototype we sampled 1,000 articles from 12months of digital publication from The Philadelphia Inquirer, and we are in the process of mapping our results. The system extracted a total of 4,652 locations, inclusive of duplicate mentions. Articles were pulled from the Opinion, Real Estate, Health, Politics, and Food sections. We’re developing the tool to update daily with new articles published by whichever newsroom is using it.
The plan to share the prototype and eventually the tool
We will be publishing our prototype alongside regular updates, when available, and we are continuing to update the model as well as the location disambiguation pipeline. Additionally, we will be publishing our code and documentation on Github and will link to it from our site. A technical write-up will follow, detailing specifics to our approach.
A few final thoughts
We envision this tool spurring ideas for a variety of new news products or approaches that leverage this information by giving journalists, editors, and business leaders within news organizations access to data about the relationship between geography and their news coverage. As research labs operating parallel to news organizations however, we’re primarily interested in what can we learn from this exercise, and what we can’t, about the effectiveness of local coverage by building and analyzing a local news map. Ultimately, can this research be leveraged to enhance how local newsrooms cover communities?
Get Connected
If you’re interested in the project and would like to be involved, please contact Michael Krisch and Sarah Schmalbach at mkrisch@columbia.edu or sarah@lenfestinstitute.org.
The Lenfest Local Lab is a multidisciplinary product and user experience innovation team located in Philadelphia supported by The Lenfest Institute for Journalism.