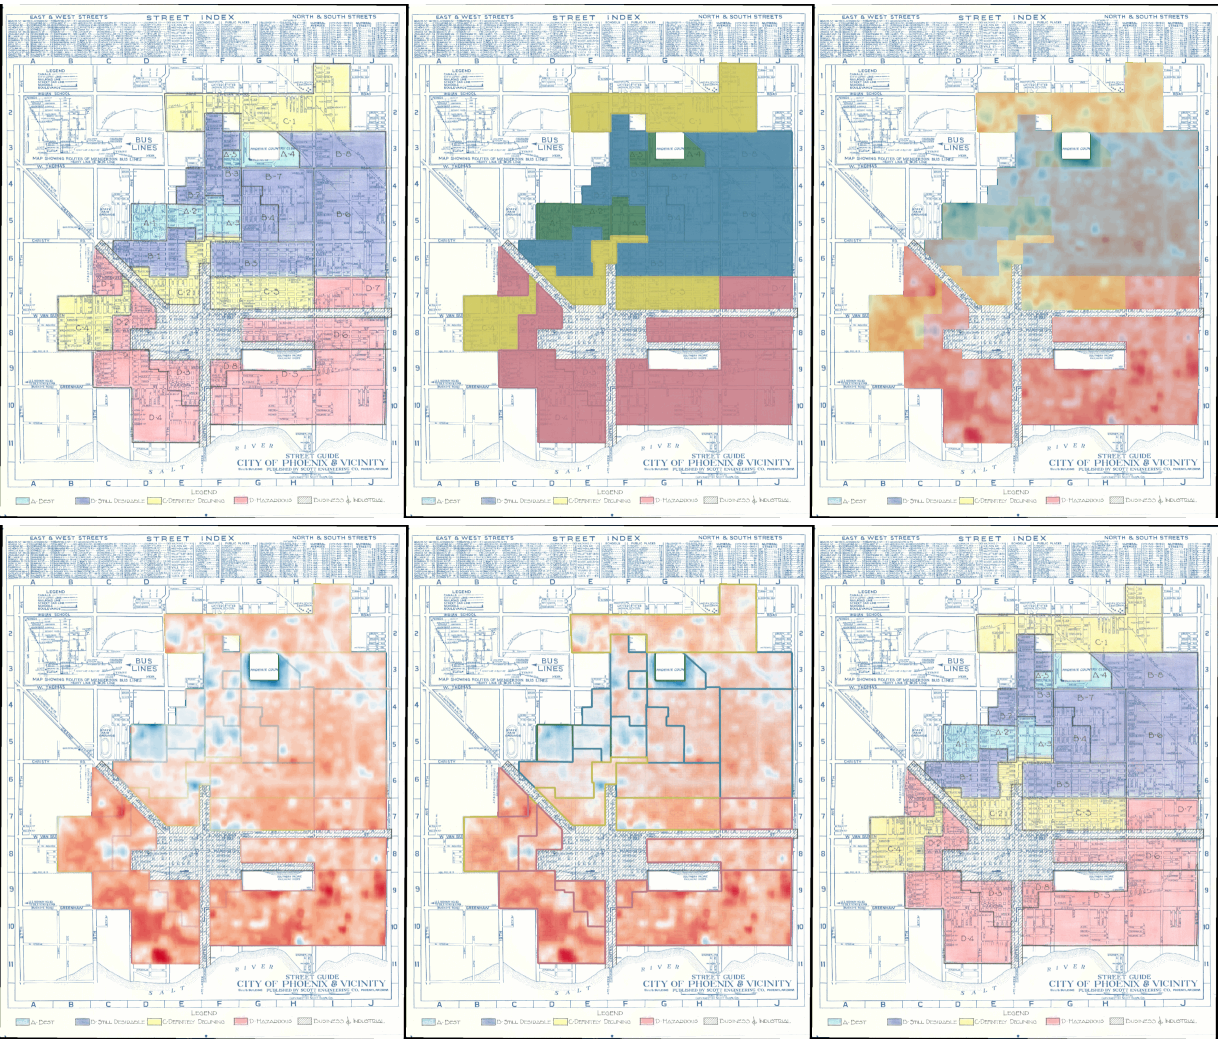
In 1933, amidst the Great Depression, Franklin D. Roosevelt’s New Deal gave rise to the Home Owners’ Loan Corporation (HOLC), an effort aimed at preventing widespread foreclosures. However, this effort unwittingly mapped the trajectory of urban heat islands in American cities through a practice that graded neighborhoods based on perceived lending risks, a significant determinant being the racial composition of those areas. A consequence of this initiative was the entrenched environmental repercussions, characterized by significant temperature and greenspace disparities that resonate to this day.
Grades of Heat is a digital tool to explore the environmental repercussions of the 1930s HOLC neighborhood gradings, offering data-based insights to researchers, journalists, and the public.
About the Interactive Tool
Grades of Heat leverages sophisticated satellite image processing techniques to analyze the urban heat island phenomenon at the intersection of historic HOLC grading. Drawing upon a decade’s worth of data from the Landsat 8 imagery from 2013-2023, the tool illuminates the complex environmental patterns that developed over time due to these initial socio-economic mapping endeavors.
The project takes into consideration two core environmental parameters: the land surface temperature (LST) and the normalized difference vegetation index (NDVI). Through a critical lens, it explores the apparent relationship between historically low HOLC grades and exacerbated urban heat, presenting an analytical gateway for journalists, researchers, and the general public to explore the thermal legacy left by the HOLCs.
Navigating the Tool
Grades of Heat offers two primary views: a map and trend view, each facilitating a nuanced analysis of the intricate relationships between HOLC grades, temperature, and vegetation. Through an interactive map interface, users can delve deep into city-level data, unraveling the intricacies of urban heat patterns, and vegetation presence that paint a nuanced picture of environmental inequalities borne from historical redlining.
Encouraging an interdisciplinary approach to addressing urban environmental disparities, Grades of Heat is also an invaluable repository of well-processed data, built from thousands of satellite images over a ten-year span. All data incorporated into the tool can be downloaded at a city and national level. It aims to serve as a cornerstone for narratives that are both grounded in science and centered on the lived experiences of communities historically affected by redlining policies.
The tool was built and supported by the Brown Institute for Media Innovation.The Institute invites collaboration and knowledge sharing, with an open invitation to contact them for further guidance or data requests. For further information or inquiries, please contact Michael Krisch at mkrisch@columbia.edu.
To access Grades of Heat, visit heat.brown.columbia.edu.

