Graphical (or pictorial) presentations of data have become an almost essential part of journalistic practice. Data visualization helps us see patterns in data and is an important tool for finding
M
Mon
|
T
Tue
|
W
Wed
|
T
Thu
|
F
Fri
|
S
Sat
|
S
Sun
|
---|---|---|---|---|---|---|
0 events,
|
0 events,
|
0 events,
|
0 events,
|
0 events,
|
1 event,
-
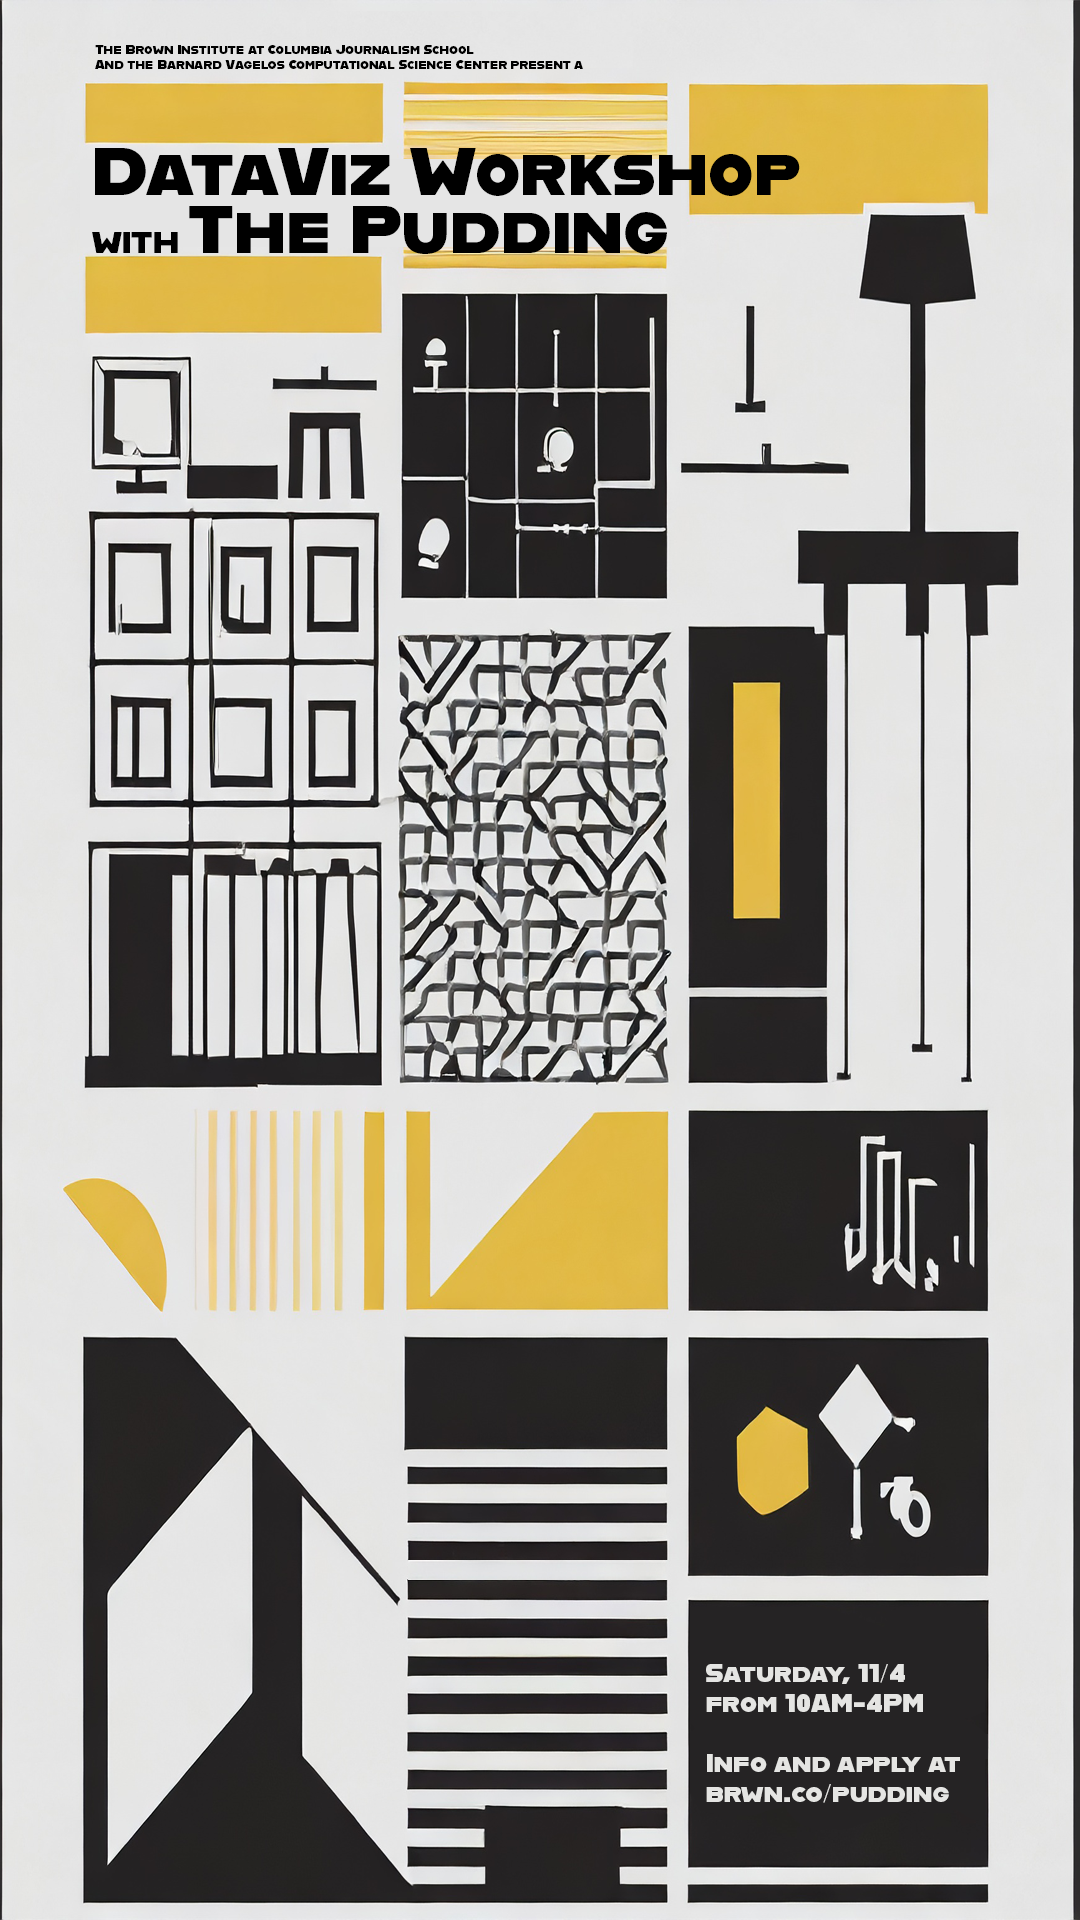
![]() Graphical (or pictorial) presentations of data have become an almost essential part of journalistic practice. Data visualization helps us see patterns in data and is an important tool for finding |
0 events,
|
0 events,
|
0 events,
|
1 event,
-
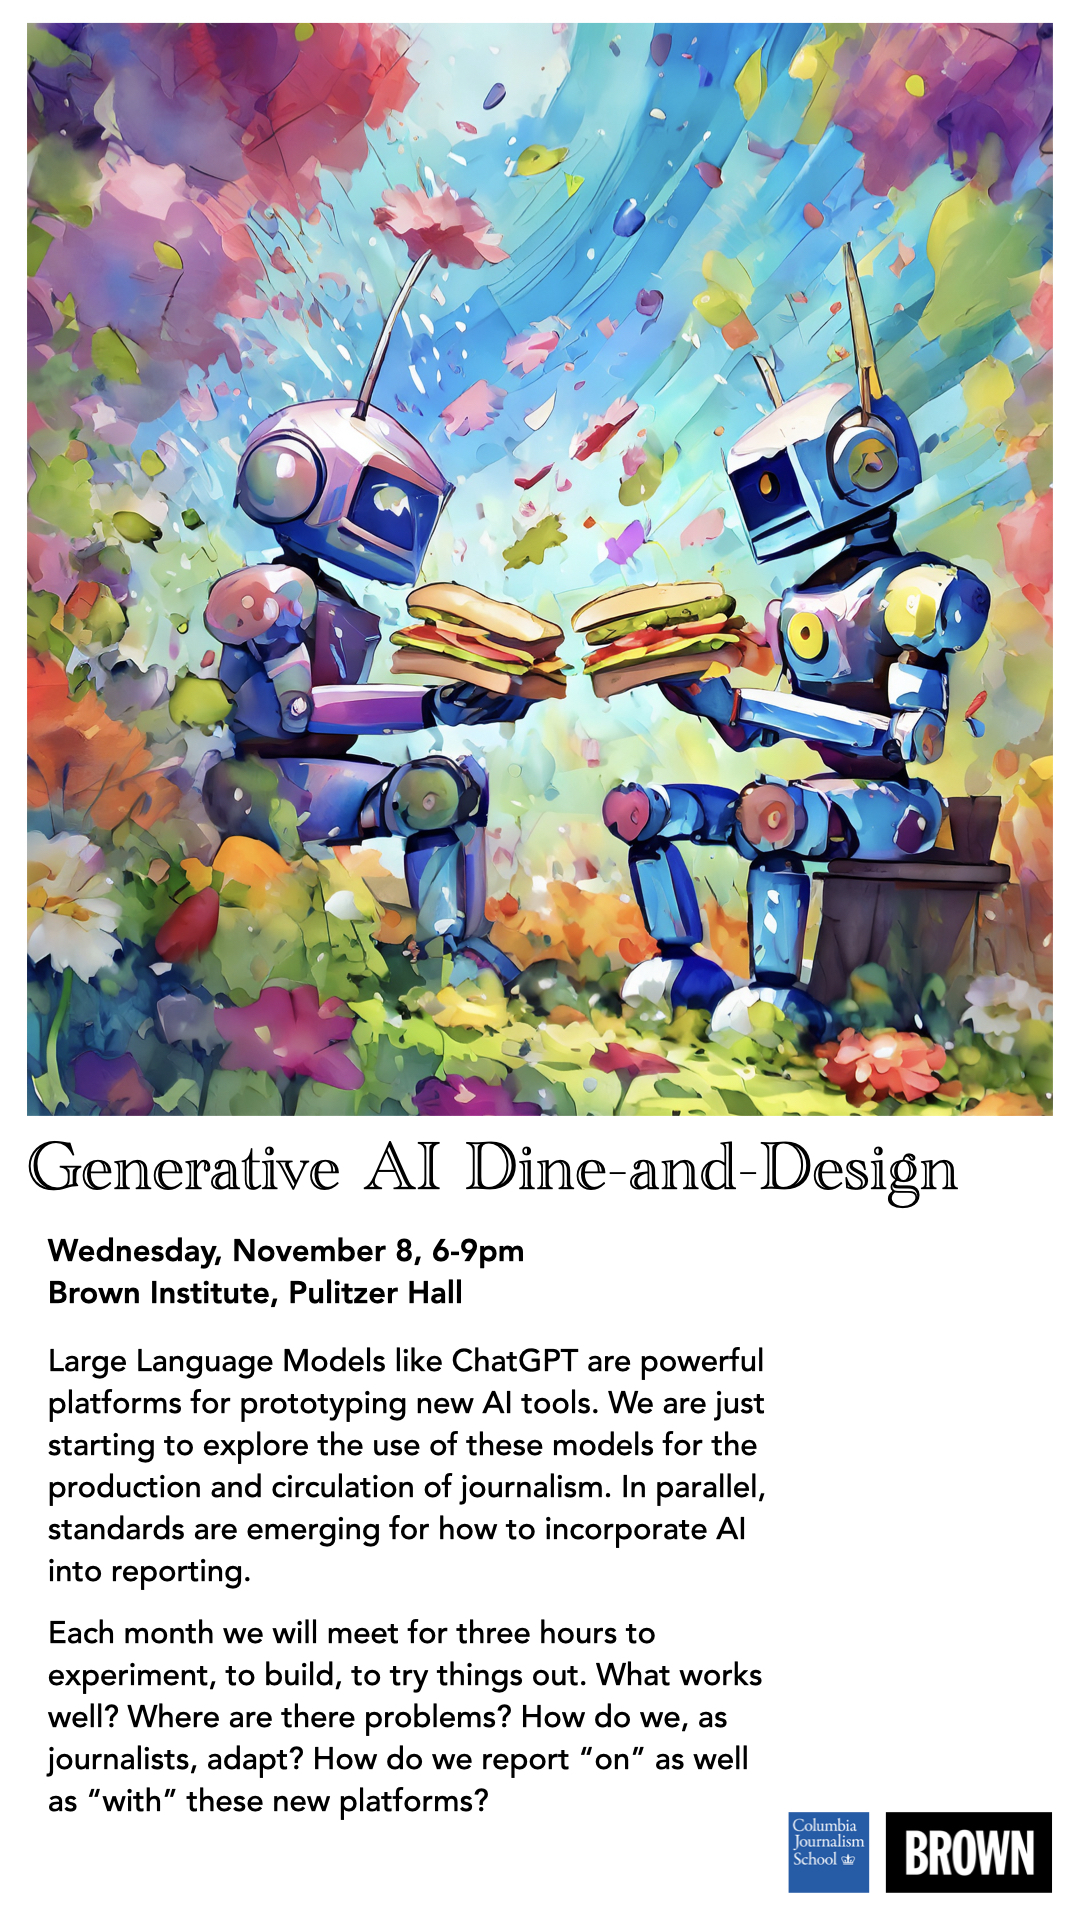
![]() In the last year, new generative AI platforms have made headlines. Large Language Models (LLMs) like ChatGPT, Bard, LLaMA and claude have been compared on their abilities to perform knowledge |
1 event,
-
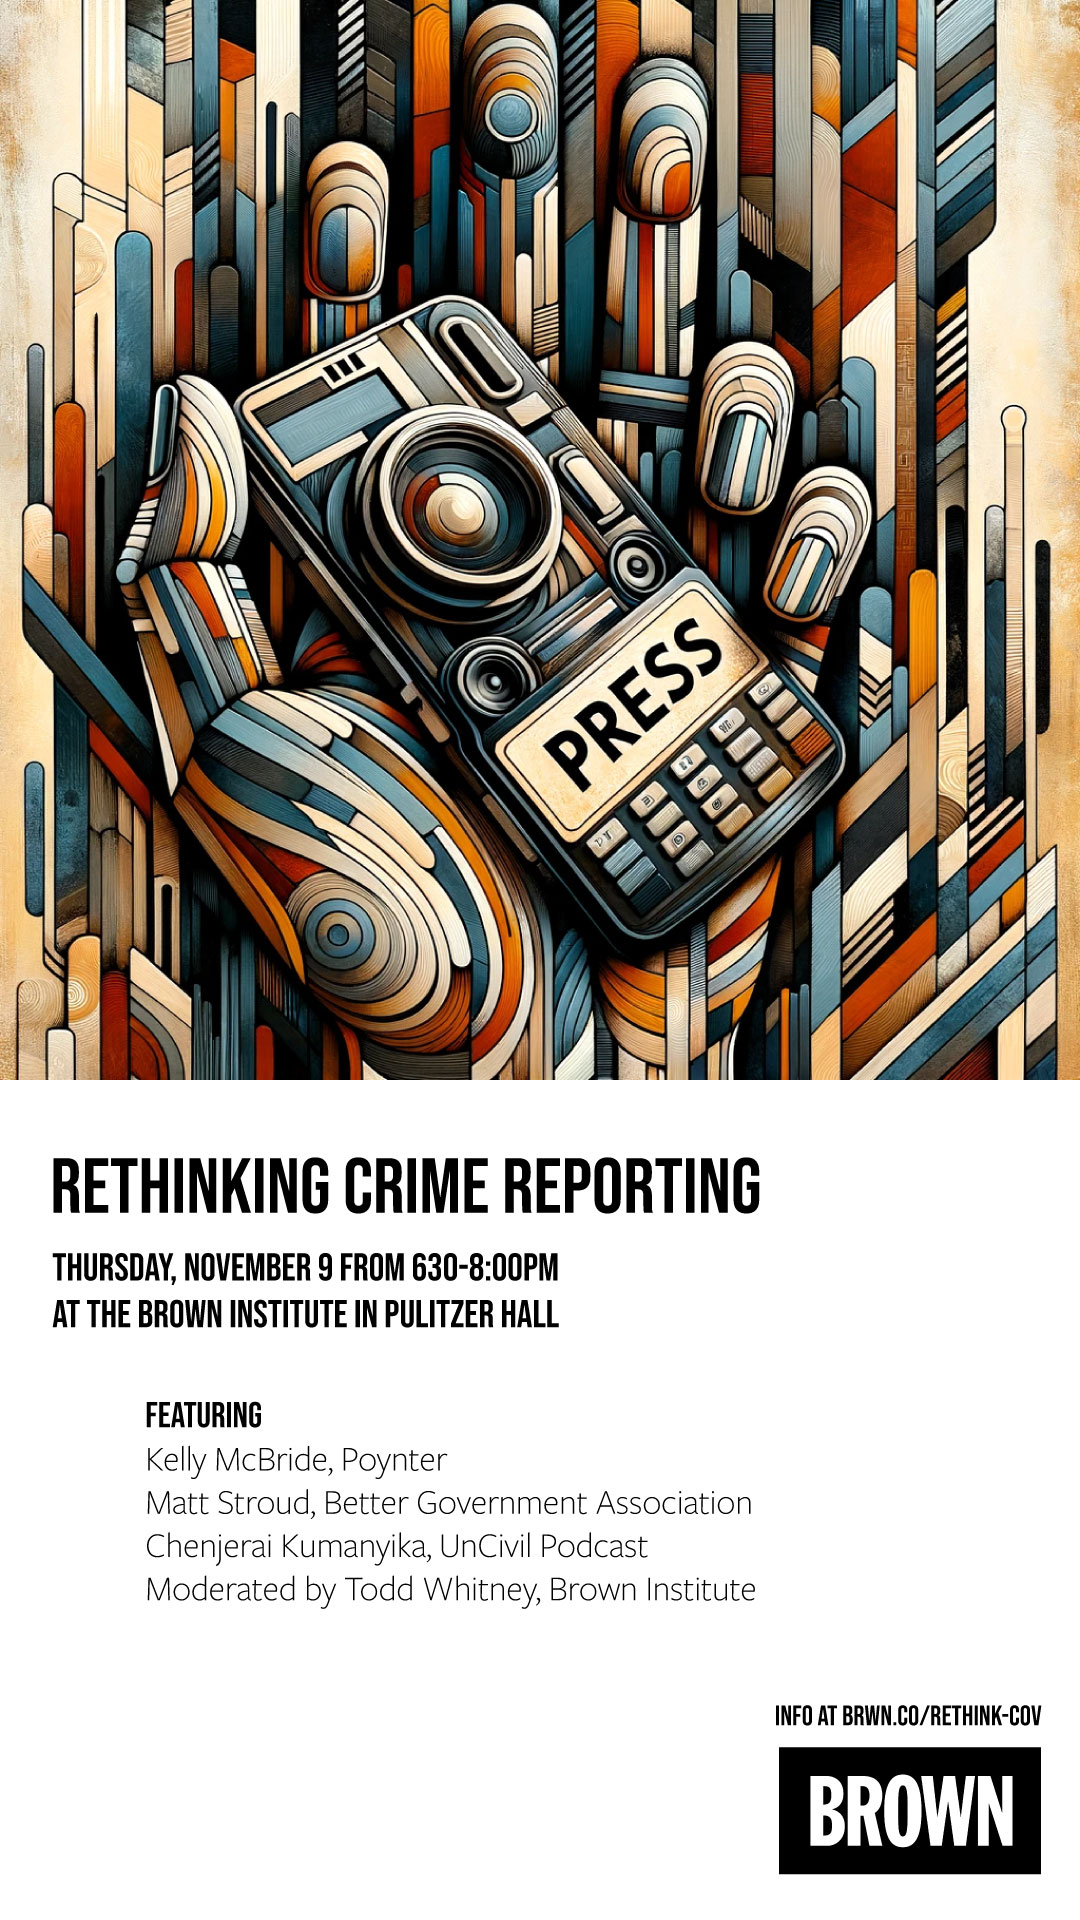
![]() The crime beat has long been leveraged by American newsrooms to drive traffic, generate revenue, and fulfill the duty of informing the public. While the familiar narrative of perpetrators committing |
0 events,
|
1 event,
Register to attend! Join the Brown Institute for a unique opportunity to learn about the latest trends in news product development! Our weekend-long event, taking place November 11 and 12, is led by industry leaders Dalit Shalom, Lead Product Designer at the New York Times, and Justin Hendrix, CEO and Editor of Tech Policy Press. |
|
0 events,
|
0 events,
|
0 events,
|
0 events,
|
0 events,
|
0 events,
|
0 events,
|
0 events,
|
0 events,
|
0 events,
|
0 events,
|
0 events,
|
0 events,
|
0 events,
|
0 events,
|
0 events,
|
0 events,
|
0 events,
|
0 events,
|
0 events,
|
0 events,
|