-
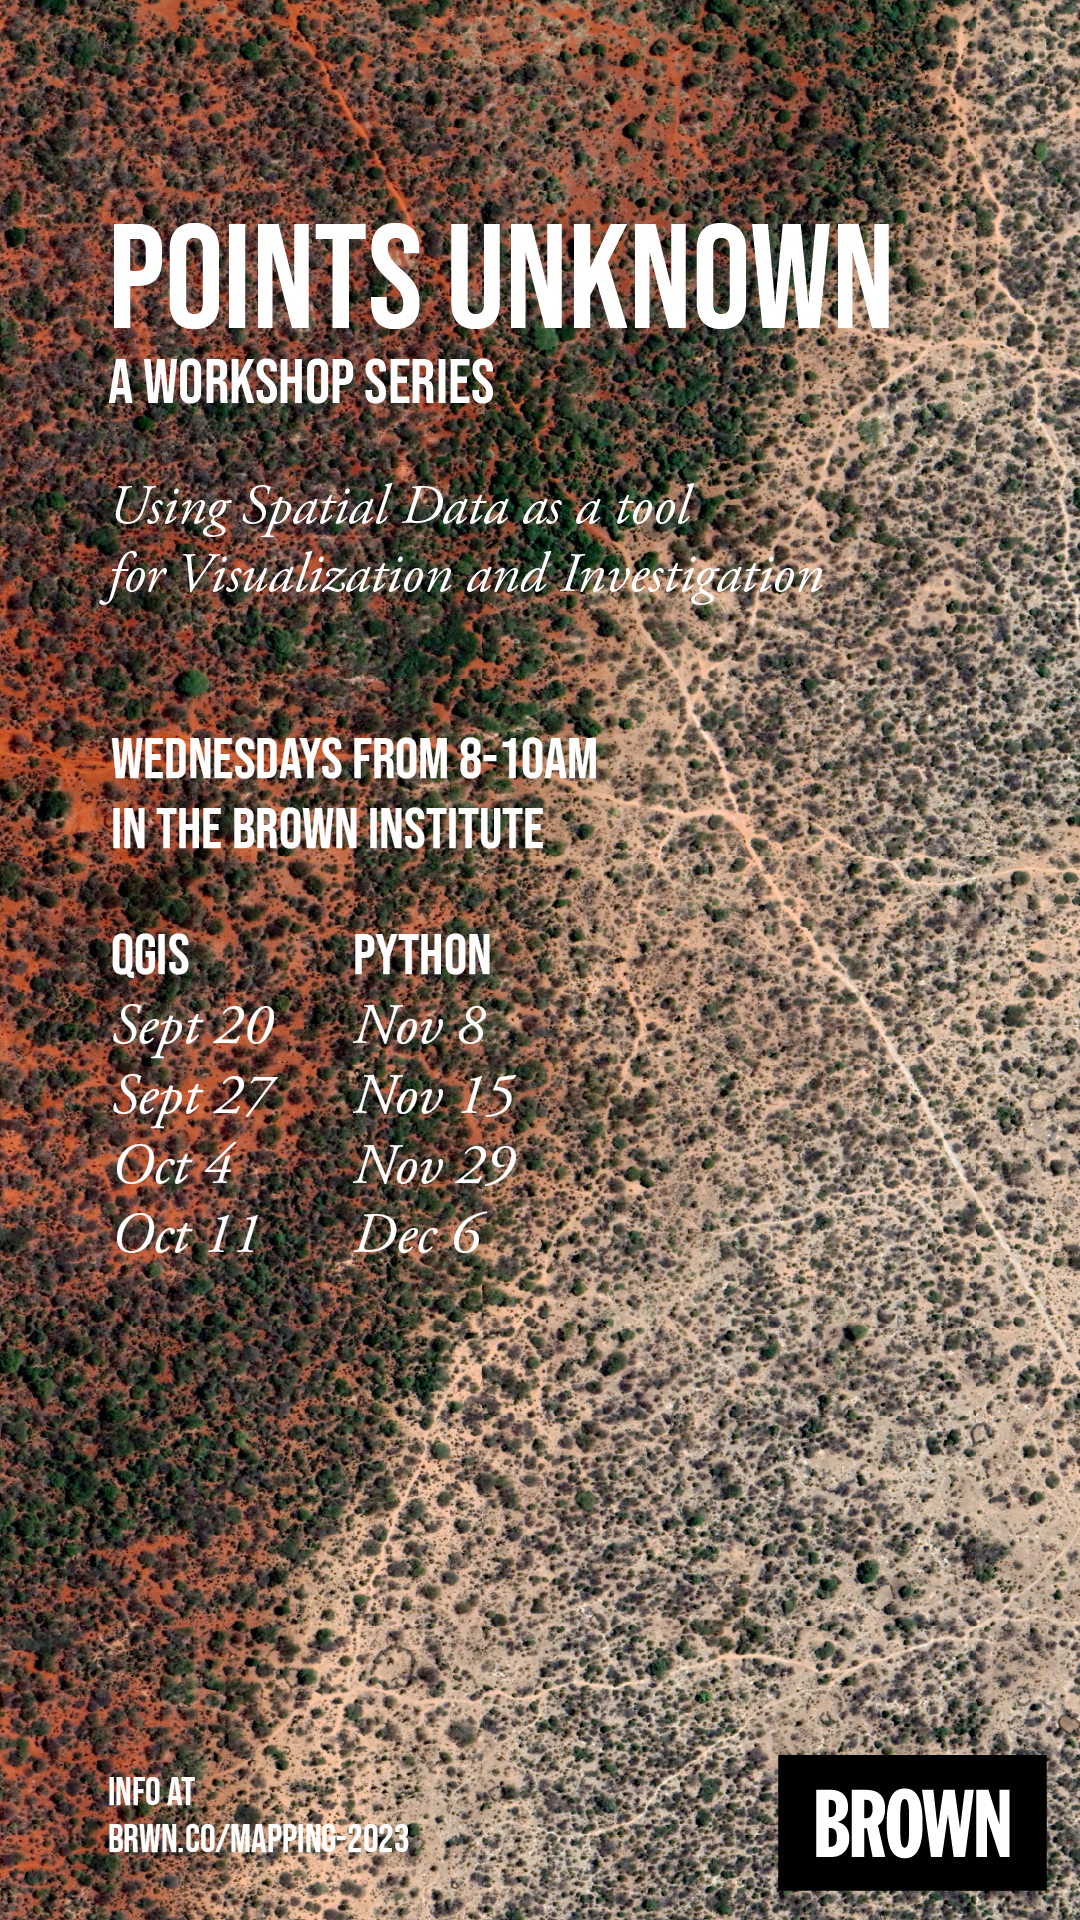
Points Unknown, a workshop series designed for journalism students, is an eight-week series to introduce students to spatial investigative and visualization techniques. News unfolds in places and every newsworthy event is shaped by the details of location. Those details might include the specifics of a neighborhood as it is today or of the history leading